Dollar General 2012 Annual Report Download - page 118
Download and view the complete annual report
Please find page 118 of the 2012 Dollar General annual report below. You can navigate through the pages in the report by either clicking on the pages listed below, or by using the keyword search tool below to find specific information within the annual report.-
 1
1 -
2
-
3
-
4
-
5
-
6
-
7
-
8
-
9
-
10
-
11
-
12
-
13
-
14
-
15
-
16
-
17
-
18
-
19
-
20
-
21
-
22
-
23
-
24
-
25
-
26
-
27
-
28
-
29
-
30
-
31
-
32
-
33
-
34
-
35
-
36
-
37
-
38
-
39
-
40
-
41
-
42
-
43
-
44
-
45
-
46
-
47
-
48
-
49
-
50
-
51
-
52
-
53
-
54
-
55
-
56
-
57
-
58
-
59
-
60
-
61
-
62
-
63
-
64
-
65
-
66
-
67
-
68
-
69
-
70
-
71
-
72
-
73
-
74
-
75
-
76
-
77
-
78
-
79
-
80
-
81
-
82
-
83
-
84
-
85
-
86
-
87
-
88
-
89
-
90
-
91
-
92
-
93
-
94
-
95
-
96
-
97
-
98
-
99
-
100
-
101
-
102
-
103
-
104
-
105
-
106
-
107
-
 108
108 -
 109
109 -
 110
110 -
 111
111 -
 112
112 -
 113
113 -
 114
114 -
 115
115 -
 116
116 -
 117
117 -
 118
118 -
 119
119 -
 120
120 -
 121
121 -
 122
122 -
 123
123 -
 124
124 -
 125
125 -
 126
126 -
 127
127 -
 128
128 -
129
-
130
-
131
-
132
-
133
-
134
-
135
-
136
-
137
-
138
-
139
-
140
-
141
-
142
-
143
-
144
-
145
-
146
-
147
-
148
-
149
-
150
-
151
-
152
-
153
-
154
-
155
-
156
-
157
-
158
-
159
-
160
-
161
-
162
-
163
-
164
-
165
-
166
-
167
-
168
-
169
-
170
-
171
-
172
-
173
-
174
-
175
-
176
-
177
-
178
-
179
-
180
-
181
-
182
-
183
-
184
-
185
-
186
-
187
-
188
-
189
-
190
-
191
-
192
-
193
-
194
-
195
-
196
-
197
 |
 |

10-K
believes the most significant of such ratios is the senior secured incurrence test under the Credit
Facilities. This test measures the ratio of the senior secured debt to Adjusted EBITDA. This ratio
would need to be no greater than 4.25 to 1 to avoid such limitations and restrictions. As of February 1,
2013, this ratio was 1.1 to 1. Senior secured debt is defined as our total debt secured by liens or similar
encumbrances less cash and cash equivalents. EBITDA is defined as income (loss) from continuing
operations before cumulative effect of change in accounting principles plus interest and other financing
costs, net, provision for income taxes, and depreciation and amortization. Adjusted EBITDA is defined
as EBITDA, further adjusted to give effect to adjustments required in calculating this covenant ratio
under our Credit Facilities. EBITDA and Adjusted EBITDA are not presentations made in accordance
with U.S. GAAP, are not measures of financial performance or condition, liquidity or profitability, and
should not be considered as an alternative to (1) net income, operating income or any other
performance measures determined in accordance with U.S. GAAP or (2) operating cash flows
determined in accordance with U.S. GAAP. Additionally, EBITDA and Adjusted EBITDA are not
intended to be measures of free cash flow for management’s discretionary use, as they do not consider
certain cash requirements such as interest payments, tax payments and debt service requirements and
replacements of fixed assets.
Our presentation of EBITDA and Adjusted EBITDA has limitations as an analytical tool, and
should not be considered in isolation or as a substitute for analysis of our results as reported under
U.S. GAAP. Because not all companies use identical calculations, these presentations of EBITDA and
Adjusted EBITDA may not be comparable to other similarly titled measures of other companies. We
believe that the presentation of EBITDA and Adjusted EBITDA is appropriate to provide additional
information about the calculation of this financial ratio in the Credit Facilities. Adjusted EBITDA is a
material component of this ratio. Specifically, non-compliance with the senior secured indebtedness
ratio contained in our Credit Facilities could prohibit us from making investments, incurring liens,
making certain restricted payments and incurring additional secured indebtedness (other than the
additional funding provided for under the senior secured credit agreement and pursuant to specified
exceptions).
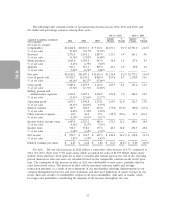
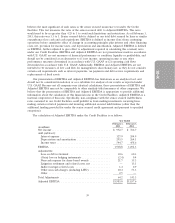
The calculation of Adjusted EBITDA under the Credit Facilities is as follows:
Year Ended
February 1, February 3,
2013 2012
(in millions)
Net income ..................................... $ 952.7 $ 766.7
Add (subtract):
Interest expense ................................ 127.9 204.9
Depreciation and amortization ..................... 293.5 264.1
Income taxes .................................. 544.7 458.6
EBITDA ...................................... 1,918.8 1,694.3
Adjustments:
Loss on debt retirement .......................... 30.6 60.3
(Gain) loss on hedging instruments .................. (2.4) 0.4
Non-cash expense for share-based awards ............. 21.7 15.3
Litigation settlement and related costs, net ............ — 13.1
Indirect merger-related costs ...................... 1.4 0.9
Other non-cash charges (including LIFO) ............. 10.4 53.3
Other ....................................... 2.5 —
Total Adjustments ................................ 64.2 143.3
Adjusted EBITDA ............................... $1,983.0 $1,837.6
39