Dollar General 2012 Annual Report Download - page 103
Download and view the complete annual report
Please find page 103 of the 2012 Dollar General annual report below. You can navigate through the pages in the report by either clicking on the pages listed below, or by using the keyword search tool below to find specific information within the annual report.-
 1
1 -
2
-
3
-
4
-
5
-
6
-
7
-
8
-
9
-
10
-
11
-
12
-
13
-
14
-
15
-
16
-
17
-
18
-
19
-
20
-
21
-
22
-
23
-
24
-
25
-
26
-
27
-
28
-
29
-
30
-
31
-
32
-
33
-
34
-
35
-
36
-
37
-
38
-
39
-
40
-
41
-
42
-
43
-
44
-
45
-
46
-
47
-
48
-
49
-
50
-
51
-
52
-
53
-
54
-
55
-
56
-
57
-
58
-
59
-
60
-
61
-
62
-
63
-
64
-
65
-
66
-
67
-
68
-
69
-
70
-
71
-
72
-
73
-
74
-
75
-
76
-
77
-
78
-
79
-
80
-
81
-
82
-
83
-
84
-
85
-
86
-
87
-
88
-
89
-
90
-
91
-
92
-
 93
93 -
 94
94 -
 95
95 -
 96
96 -
 97
97 -
 98
98 -
 99
99 -
 100
100 -
 101
101 -
 102
102 -
 103
103 -
 104
104 -
 105
105 -
 106
106 -
 107
107 -
 108
108 -
 109
109 -
 110
110 -
 111
111 -
 112
112 -
 113
113 -
114
-
115
-
116
-
117
-
118
-
119
-
120
-
121
-
122
-
123
-
124
-
125
-
126
-
127
-
128
-
129
-
130
-
131
-
132
-
133
-
134
-
135
-
136
-
137
-
138
-
139
-
140
-
141
-
142
-
143
-
144
-
145
-
146
-
147
-
148
-
149
-
150
-
151
-
152
-
153
-
154
-
155
-
156
-
157
-
158
-
159
-
160
-
161
-
162
-
163
-
164
-
165
-
166
-
167
-
168
-
169
-
170
-
171
-
172
-
173
-
174
-
175
-
176
-
177
-
178
-
179
-
180
-
181
-
182
-
183
-
184
-
185
-
186
-
187
-
188
-
189
-
190
-
191
-
192
-
193
-
194
-
195
-
196
-
197
 |
 |

10-K
12MAR201322524452
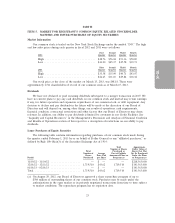
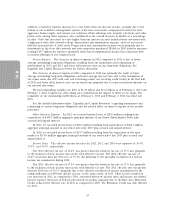
On March 19, 2013, our Board of Directors increased the authorization under the repurchase
program by $500 million, resulting in approximately $643.6 million remaining available for the
repurchase of our common stock.
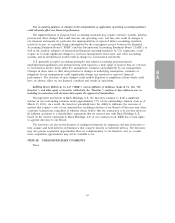
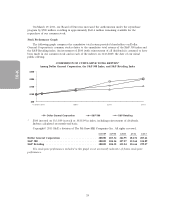
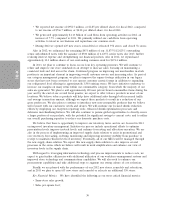
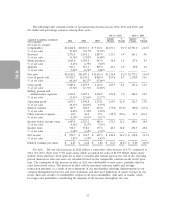
Stock Performance Graph
The following graph compares the cumulative total return provided shareholders on Dollar
General Corporation’s common stock relative to the cumulative total returns of the S&P 500 index and
the S&P Retailing index. An investment of $100 (with reinvestment of all dividends) is assumed to have
been made in our common stock and in each of the indexes on 11/13/2009, the date of our initial
public offering.
COMPARISON OF CUMULATIVE TOTAL RETURN*
Among Dollar General Corporation, the S&P 500 Index, and S&P Retailing Index
11/13/09 1/29/10 1/28/11 2/3/12 2/1/13
Dollar General Corporation S&P 500 S&P Retailing
$250
$150
$200
$100
$50
* $100 invested on 11/13/09 in stock or 10/31/09 in index, including reinvestment of dividends.
Indexes calculated on month-end basis.
Copyright↤ 2013 S&P, a division of The McGraw-Hill Companies Inc. All rights reserved.
11/13/09 1/29/10 1/28/11 2/3/12 2/1/13
Dollar General Corporation ...................... 100.00 103.34 124.95 184.51 203.61
S&P 500 .................................... 100.00 104.16 127.27 132.64 154.89
S&P Retailing ................................ 100.00 104.32 135.24 156.66 199.27
The stock price performance included in this graph is not necessarily indicative of future stock price
performance.
24