Dollar General 2012 Annual Report Download - page 132
Download and view the complete annual report
Please find page 132 of the 2012 Dollar General annual report below. You can navigate through the pages in the report by either clicking on the pages listed below, or by using the keyword search tool below to find specific information within the annual report.-
 1
1 -
2
-
3
-
4
-
5
-
6
-
7
-
8
-
9
-
10
-
11
-
12
-
13
-
14
-
15
-
16
-
17
-
18
-
19
-
20
-
21
-
22
-
23
-
24
-
25
-
26
-
27
-
28
-
29
-
30
-
31
-
32
-
33
-
34
-
35
-
36
-
37
-
38
-
39
-
40
-
41
-
42
-
43
-
44
-
45
-
46
-
47
-
48
-
49
-
50
-
51
-
52
-
53
-
54
-
55
-
56
-
57
-
58
-
59
-
60
-
61
-
62
-
63
-
64
-
65
-
66
-
67
-
68
-
69
-
70
-
71
-
72
-
73
-
74
-
75
-
76
-
77
-
78
-
79
-
80
-
81
-
82
-
83
-
84
-
85
-
86
-
87
-
88
-
89
-
90
-
91
-
92
-
93
-
94
-
95
-
96
-
97
-
98
-
99
-
100
-
101
-
102
-
103
-
104
-
105
-
106
-
107
-
108
-
109
-
110
-
111
-
112
-
113
-
114
-
115
-
116
-
117
-
118
-
119
-
120
-
121
-
 122
122 -
 123
123 -
 124
124 -
 125
125 -
 126
126 -
 127
127 -
 128
128 -
 129
129 -
 130
130 -
 131
131 -
 132
132 -
 133
133 -
 134
134 -
 135
135 -
 136
136 -
 137
137 -
 138
138 -
 139
139 -
 140
140 -
 141
141 -
 142
142 -
143
-
144
-
145
-
146
-
147
-
148
-
149
-
150
-
151
-
152
-
153
-
154
-
155
-
156
-
157
-
158
-
159
-
160
-
161
-
162
-
163
-
164
-
165
-
166
-
167
-
168
-
169
-
170
-
171
-
172
-
173
-
174
-
175
-
176
-
177
-
178
-
179
-
180
-
181
-
182
-
183
-
184
-
185
-
186
-
187
-
188
-
189
-
190
-
191
-
192
-
193
-
194
-
195
-
196
-
197
 |
 |

10-K
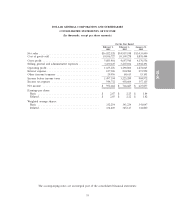
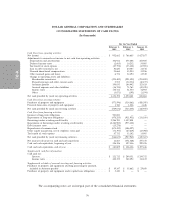
DOLLAR GENERAL CORPORATION AND SUBSIDIARIES
CONSOLIDATED STATEMENTS OF INCOME
(In thousands, except per share amounts)
For the Year Ended
February 1, February 3, January 28,
2013 2012 2011
Net sales ...................................... $16,022,128 $14,807,188 $13,035,000
Cost of goods sold ............................... 10,936,727 10,109,278 8,858,444
Gross profit .................................... 5,085,401 4,697,910 4,176,556
Selling, general and administrative expenses ............. 3,430,125 3,207,106 2,902,491
Operating profit ................................. 1,655,276 1,490,804 1,274,065
Interest expense ................................. 127,926 204,900 273,992
Other (income) expense ........................... 29,956 60,615 15,101
Income before income taxes ........................ 1,497,394 1,225,289 984,972
Income tax expense .............................. 544,732 458,604 357,115
Net income .................................... $ 952,662 $ 766,685 $ 627,857
Earnings per share:
Basic ....................................... $ 2.87 $ 2.25 $ 1.84
Diluted ...................................... $ 2.85 $ 2.22 $ 1.82
Weighted average shares:
Basic ....................................... 332,254 341,234 341,047
Diluted ...................................... 334,469 345,117 344,800
The accompanying notes are an integral part of the consolidated financial statements.
53