Dick's Sporting Goods 2011 Annual Report Download - page 2
Download and view the complete annual report
Please find page 2 of the 2011 Dick's Sporting Goods annual report below. You can navigate through the pages in the report by either clicking on the pages listed below, or by using the keyword search tool below to find specific information within the annual report.-
 1
1 -
 2
2 -
 3
3 -
 4
4 -
 5
5 -
 6
6 -
 7
7 -
 8
8 -
 9
9 -
 10
10 -
 11
11 -
 12
12 -
 13
13 -
14
-
15
-
16
-
17
-
18
-
19
-
20
-
21
-
22
-
23
-
24
-
25
-
26
-
27
-
28
-
29
-
30
-
31
-
32
-
33
-
34
-
35
-
36
-
37
-
38
-
39
-
40
-
41
-
42
-
43
-
44
-
45
-
46
-
47
-
48
-
49
-
50
-
51
-
52
-
53
-
54
-
55
-
56
-
57
-
58
-
59
-
60
-
61
-
62
-
63
-
64
-
65
-
66
-
67
-
68
-
69
-
70
-
71
-
72
-
73
-
74
-
75
-
76
-
77
-
78
-
79
-
80
-
81
-
82
-
83
-
84
-
85
-
86
-
87
-
88
-
89
-
90
-
91
-
92
-
93
-
94
-
95
-
96
-
97
-
98
-
99
-
100
-
101
-
102
-
103
-
104
-
105
-
106
-
107
-
108
-
109
-
110
-
111
-
112
-
113
-
114
 |
 |

FINANCIAL HIGHLIGHTS
Fiscal Year 2011 2010 2009
(dollars in thousands, except per share data)
Net sales $ 5,211,802 $ 4,871,492 $ 4,412,835
Gross profi t 1,594,881 1,449,030 1,216,936
Gross profi t margin 30.6% 29.7% 27.6%
Selling, general and administrative expenses 1,148,268 1,129,293 972,025
Pre-opening expenses 14,593 10,488 9,227
Merger and integration costs — — 10,113
Income from operations 432,020 309,249 225,571
Net income $ 263,906 $ 182,077 $ 135,359
Adjusted net income1 $ 253,879 $ 198,396 $ 141,427
Diluted earnings per common share $ 2.10 $ 1.50 $ 1.15
Adjusted diluted earnings per common share1 $ 2.02 $ 1.63 $ 1.20
Diluted weighted average shares outstanding (in thousands) 125,768 121,724 117,955
Total stockholders’ equity $ 1,632,745 $ 1,363,581 $ 1,083,227
EBITDA $ 562,475 $ 421,921 $ 328,667
Adjusted EBITDA1 $ 546,427 $ 449,118 $ 336,302
Same store sales increase (decrease) 2 2.0% 7.2% (1.4%)
Store count (Dick’s Sporting Goods stores) 480 444 419
1 Results exclude merger and integration costs, expenses associated with the closure of 12 underperforming Golf Galaxy stores and a litigation
settlement charge in 2010, and a gain on sale of investment and the favorable impact of lower litigation settlement costs in 2011.
2 2009 same store sales include Dick’s Sporting Goods and Golf Galaxy sales. 2010 and 2011 same
store sales include Dick’s Sporting Goods, Golf Galaxy and the Company’s eCommerce business.
3 Results exclude goodwill, other intangible and store asset impairment charges, merger and integration costs, expenses associated
with the closure of 12 underperforming Golf Galaxy stores, litigation settlement charges and a gain on sale of investment.
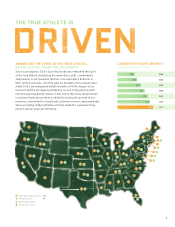
NET SALES
(in millions)
$3,888
2007
$4,130
2008
$4,413
2009
$4,871
2010
$5,212
2011
6.9%
2007
5.8%
2008
5.3%
2009
6.9%
2010
8.2%
2011
OPERATING MARGINS
3
$150.6
2007
$134 .1
2008
$141.4
2009
$198.4
2010
$253.9
2011
ADJUSTED NET INCOME
3
(in millions)
29.8%
2007
28.7%
2008
27.6%
2009
29.7%
2010
30.6%
2011
GROSS PROFIT MARGINS