Delta Airlines 2013 Annual Report Download - page 83
Download and view the complete annual report
Please find page 83 of the 2013 Delta Airlines annual report below. You can navigate through the pages in the report by either clicking on the pages listed below, or by using the keyword search tool below to find specific information within the annual report.-
 1
1 -
2
-
3
-
4
-
5
-
6
-
7
-
8
-
9
-
10
-
11
-
12
-
13
-
14
-
15
-
16
-
17
-
18
-
19
-
20
-
21
-
22
-
23
-
24
-
25
-
26
-
27
-
28
-
29
-
30
-
31
-
32
-
33
-
34
-
35
-
36
-
37
-
38
-
39
-
40
-
41
-
42
-
43
-
44
-
45
-
46
-
47
-
48
-
49
-
50
-
51
-
52
-
53
-
54
-
55
-
56
-
57
-
58
-
59
-
60
-
61
-
62
-
63
-
64
-
65
-
66
-
67
-
68
-
69
-
70
-
71
-
72
-
 73
73 -
 74
74 -
 75
75 -
 76
76 -
 77
77 -
 78
78 -
 79
79 -
 80
80 -
 81
81 -
 82
82 -
 83
83 -
 84
84 -
 85
85 -
 86
86 -
 87
87 -
 88
88 -
 89
89 -
 90
90 -
 91
91 -
 92
92 -
 93
93 -
94
-
95
-
96
-
97
-
98
-
99
-
100
-
101
-
102
-
103
-
104
-
105
-
106
-
107
-
108
-
109
-
110
-
111
-
112
-
113
-
114
-
115
-
116
-
117
-
118
-
119
-
120
-
121
-
122
-
123
-
124
-
125
-
126
-
127
-
128
-
129
-
130
-
131
-
132
-
133
-
134
-
135
-
136
-
137
-
138
-
139
-
140
-
141
-
142
-
143
-
144
-
145
-
146
-
147
-
148
-
149
-
150
-
151
 |
 |
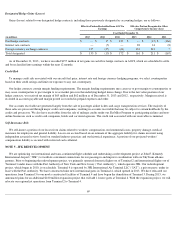
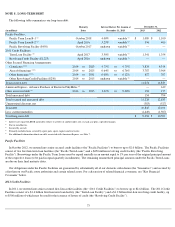
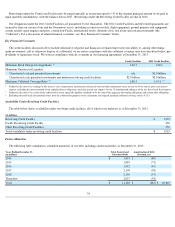
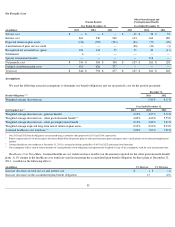
Fair Value of Debt
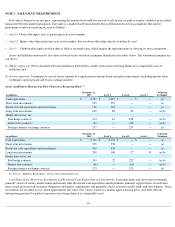
Market risk associated with our fixed and variable rate long-term debt relates to the potential reduction in fair value and negative impact to
future earnings, respectively, from an increase in interest rates. In the table below, the aggregate fair value of debt was based primarily on
reported market values, recently completed market transactions and estimates based on interest rates, maturities, credit risk and underlying
collateral and is classified primarily as Level 2 within the fair value hierarchy.
NOTE 9 . LEASE OBLIGATIONS
We lease aircraft, airport terminals, maintenance facilities, ticket offices and other property and equipment from third parties. Rental expense
for operating leases, which is recorded on a straight-line basis over the life of the lease term, totaled approximately $1.1 billion for each of the
years ended
December 31, 2013 , 2012 and 2011 . Amounts due under capital leases are recorded as liabilities, while assets acquired under
capital leases are recorded as property and equipment. Amortization of assets recorded under capital leases is included in depreciation and
amortization expense. Our airport terminal leases include contingent rents, which vary based upon: facility usage, enplanements, aircraft weight
and other factors. Many of our aircraft, facility and equipment leases include rental escalation clauses and/or renewal options. Our leases do not
include residual value guarantees and we are not the primary beneficiary in or have other forms of variable interest with the lessor of the leased
assets. As a result, we have not consolidated any of the entities that lease to us.
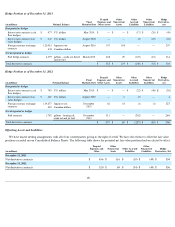
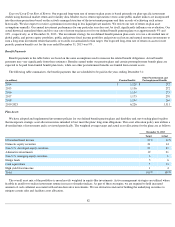
The following tables summarize, as of December 31, 2013 , our minimum rental commitments under capital leases and noncancelable
operating leases (including certain aircraft flown by Contract Carriers) with initial or remaining terms in excess of one year:
Capital Leases
75
December 31,
(in millions) 2013 2012
Total debt at par value
$
11,228
$
12,633
Unamortized discount, net
(383
)
(527
)
Net carrying amount
$
10,845
$
12,106
Fair value
$
11,600
$
13,000
Years Ending December 31,
(in millions) Total
2014
$
165
2015
158
2016
143
2017
100
2018
54
Thereafter
74
Total minimum lease payments
694
Less: amount of lease payments representing interest
(197
)
Present value of future minimum capital lease payments
497
Less: current obligations under capital leases
(98
)
Long-term capital lease obligations
$
399