Delta Airlines 2013 Annual Report Download - page 33
Download and view the complete annual report
Please find page 33 of the 2013 Delta Airlines annual report below. You can navigate through the pages in the report by either clicking on the pages listed below, or by using the keyword search tool below to find specific information within the annual report.-
 1
1 -
2
-
3
-
4
-
5
-
6
-
7
-
8
-
9
-
10
-
11
-
12
-
13
-
14
-
15
-
16
-
17
-
18
-
19
-
20
-
21
-
22
-
 23
23 -
 24
24 -
 25
25 -
 26
26 -
 27
27 -
 28
28 -
 29
29 -
 30
30 -
 31
31 -
 32
32 -
 33
33 -
 34
34 -
 35
35 -
 36
36 -
 37
37 -
 38
38 -
 39
39 -
 40
40 -
 41
41 -
 42
42 -
 43
43 -
44
-
45
-
46
-
47
-
48
-
49
-
50
-
51
-
52
-
53
-
54
-
55
-
56
-
57
-
58
-
59
-
60
-
61
-
62
-
63
-
64
-
65
-
66
-
67
-
68
-
69
-
70
-
71
-
72
-
73
-
74
-
75
-
76
-
77
-
78
-
79
-
80
-
81
-
82
-
83
-
84
-
85
-
86
-
87
-
88
-
89
-
90
-
91
-
92
-
93
-
94
-
95
-
96
-
97
-
98
-
99
-
100
-
101
-
102
-
103
-
104
-
105
-
106
-
107
-
108
-
109
-
110
-
111
-
112
-
113
-
114
-
115
-
116
-
117
-
118
-
119
-
120
-
121
-
122
-
123
-
124
-
125
-
126
-
127
-
128
-
129
-
130
-
131
-
132
-
133
-
134
-
135
-
136
-
137
-
138
-
139
-
140
-
141
-
142
-
143
-
144
-
145
-
146
-
147
-
148
-
149
-
150
-
151
 |
 |

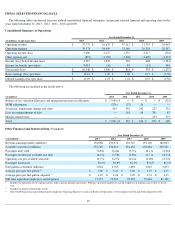
ITEM 7. MANAGEMENT'S DISCUSSION AND ANALYSIS OF FINANCIAL CONDITION AND RESULTS OF OPERATIONS
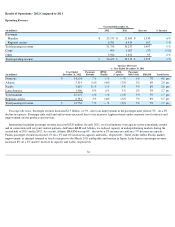
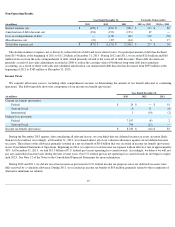
Financial Highlights - 2013 Compared to 2012
Our net income for 2013 was $10.5 billion, which reflects $8.0 billion of income tax benefits primarily due to the release of the tax valuation
allowance. Income before income taxes was $2.5 billion, representing a $1.5 billion improvement over prior year. Our pre-tax operating margin
rose by 4 percentage points to 7% on both higher revenues and lower costs.
2013 was a successful year for Delta based on several measures. Our pre-tax profits were 147% higher than the prior year. Our operating
performance led the industry, driving customer satisfaction and doubling our domestic net promoter scores, a metric measuring customer
satisfaction. Our completion factor was 99.7% with over 70 days where none of our flights were canceled. We ranked number two in the
industry for bag performance as measured by the U.S. Department of Transportation. During the year, we returned over $350 million to our
shareholders through dividends and a share purchase program. We also rejoined the Standard & Poor's 500 index of large companies.
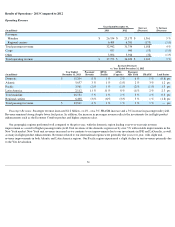
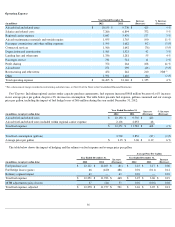
Revenue. Our passenger revenue increased $1.2 billion, despite a lower market price of fuel. We experienced positive market reaction to our
first class upsell and Economy Comfort products. Our customers value these products, which together contributed more than $600 million in
revenues. Our geographic regions performed well compared to the prior year, with the domestic region leading year-over-year unit revenue
improvement. Unit revenues of the domestic region rose by over 5% with notable improvements in the New York market. New York unit
revenues increased as we continue to see improvements due to our investments in JFK and LaGuardia, as well as many in-flight product
enhancements. Revenues related to our international regions were generally flat year-over-year, with slight unit revenue improvements in both
Atlantic and Latin America regions. Our Pacific region experienced a slight decline in unit revenues primarily due to the Yen devaluation.
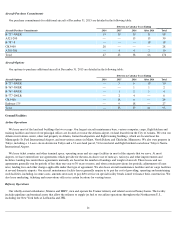
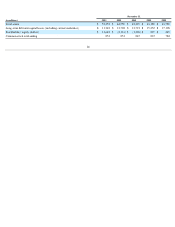
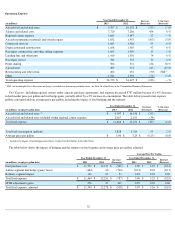
Operating Expense. Total operating expense decreased $122 million
from 2012. As a result, our consolidated operating cost per available seat
mile ("CASM") for 2013 decreased 1% to 14.77 cent s from 14.97 cent s in 2012, on a 1% increase in capacity. CASM-Ex (a non-GAAP
financial measure) was 9.14 cent s in 2013, or 2% higher than 2012.
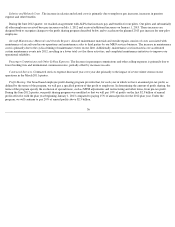
Changes in our total operating expenses reflect decreased fuel expense offset by higher salaries and related costs and profit sharing. Fuel
expense for 2013 was $11.5 billion , including regional carriers; our average price per gallon was $3.00, which was $0.25 lower than 2012. Our
average price per gallon, adjusted was $3.07 (a non-GAAP financial measure), which was $0.19 lower than 2012. Our fuel cost includes net
airline segment fuel hedge gains for the year of $444 million, and a loss on refinery operations of $116 million, or $0.03 per gallon. The higher
salaries expense represents wage increases and shows the continued investment we are making in our employees. Delta relies on its employees
for its operational and financial success. As a result of our success in 2013, we will pay our employees record profit sharing of $506 million,
which represents over 8% of an employee's annual pay, and is a 36% year-over-year increase.
Income Tax . We have released the tax valuation allowance that placed a reserve against certain tax assets. We now believe that, given the
company's financial performance, we will be able to use these tax assets to offset future cash income tax liabilities. We recognized an $8.0
billion tax benefit primarily as a result of releasing the valuation, which was recorded in income tax benefit (provision) in our Consolidated
Statement of Operations. Beginning in 2014, we expect to record income tax expense with an effective rate of approximately 38%. As of
December 31, 2013, we have more than $15 billion of net operating loss carryforwards ("NOLs") that will be used to offset cash income taxes
due on future earnings.
The non-GAAP financial measure CASM-Ex used in this section is defined and reconciled in "Supplemental Information" below. Average
fuel price per gallon, adjusted is defined and reconciled in "Results of Operations - Year Ended 2013 and 2012 - Operating Expense" below.
Company Initiatives
Increasing Shareholder Value
We continue to focus on cash flow generation with the goal of further strengthening our balance sheet. We finished 2013 with $5.7 billion in
unrestricted liquidity (consisting of cash, cash equivalents, short-term investments and undrawn revolving credit facility capacity). During 2013,
we generated $4.5 billion in cash from operating activities, reduced debt by $1.4 billion and funded capital expenditures of $2.6 billion and
returned $350 million to shareholders, while maintaining a solid liquidity position.
27