Delta Airlines 2013 Annual Report Download - page 76
Download and view the complete annual report
Please find page 76 of the 2013 Delta Airlines annual report below. You can navigate through the pages in the report by either clicking on the pages listed below, or by using the keyword search tool below to find specific information within the annual report.-
 1
1 -
2
-
3
-
4
-
5
-
6
-
7
-
8
-
9
-
10
-
11
-
12
-
13
-
14
-
15
-
16
-
17
-
18
-
19
-
20
-
21
-
22
-
23
-
24
-
25
-
26
-
27
-
28
-
29
-
30
-
31
-
32
-
33
-
34
-
35
-
36
-
37
-
38
-
39
-
40
-
41
-
42
-
43
-
44
-
45
-
46
-
47
-
48
-
49
-
50
-
51
-
52
-
53
-
54
-
55
-
56
-
57
-
58
-
59
-
60
-
61
-
62
-
63
-
64
-
65
-
 66
66 -
 67
67 -
 68
68 -
 69
69 -
 70
70 -
 71
71 -
 72
72 -
 73
73 -
 74
74 -
 75
75 -
 76
76 -
 77
77 -
 78
78 -
 79
79 -
 80
80 -
 81
81 -
 82
82 -
 83
83 -
 84
84 -
 85
85 -
 86
86 -
87
-
88
-
89
-
90
-
91
-
92
-
93
-
94
-
95
-
96
-
97
-
98
-
99
-
100
-
101
-
102
-
103
-
104
-
105
-
106
-
107
-
108
-
109
-
110
-
111
-
112
-
113
-
114
-
115
-
116
-
117
-
118
-
119
-
120
-
121
-
122
-
123
-
124
-
125
-
126
-
127
-
128
-
129
-
130
-
131
-
132
-
133
-
134
-
135
-
136
-
137
-
138
-
139
-
140
-
141
-
142
-
143
-
144
-
145
-
146
-
147
-
148
-
149
-
150
-
151
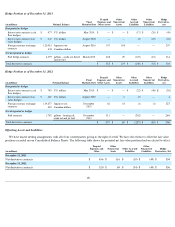
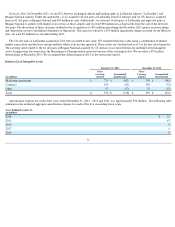
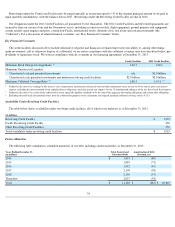
 |
 |
Hedge Position as of
December 31, 2013
Hedge Position as of
December 31, 2012
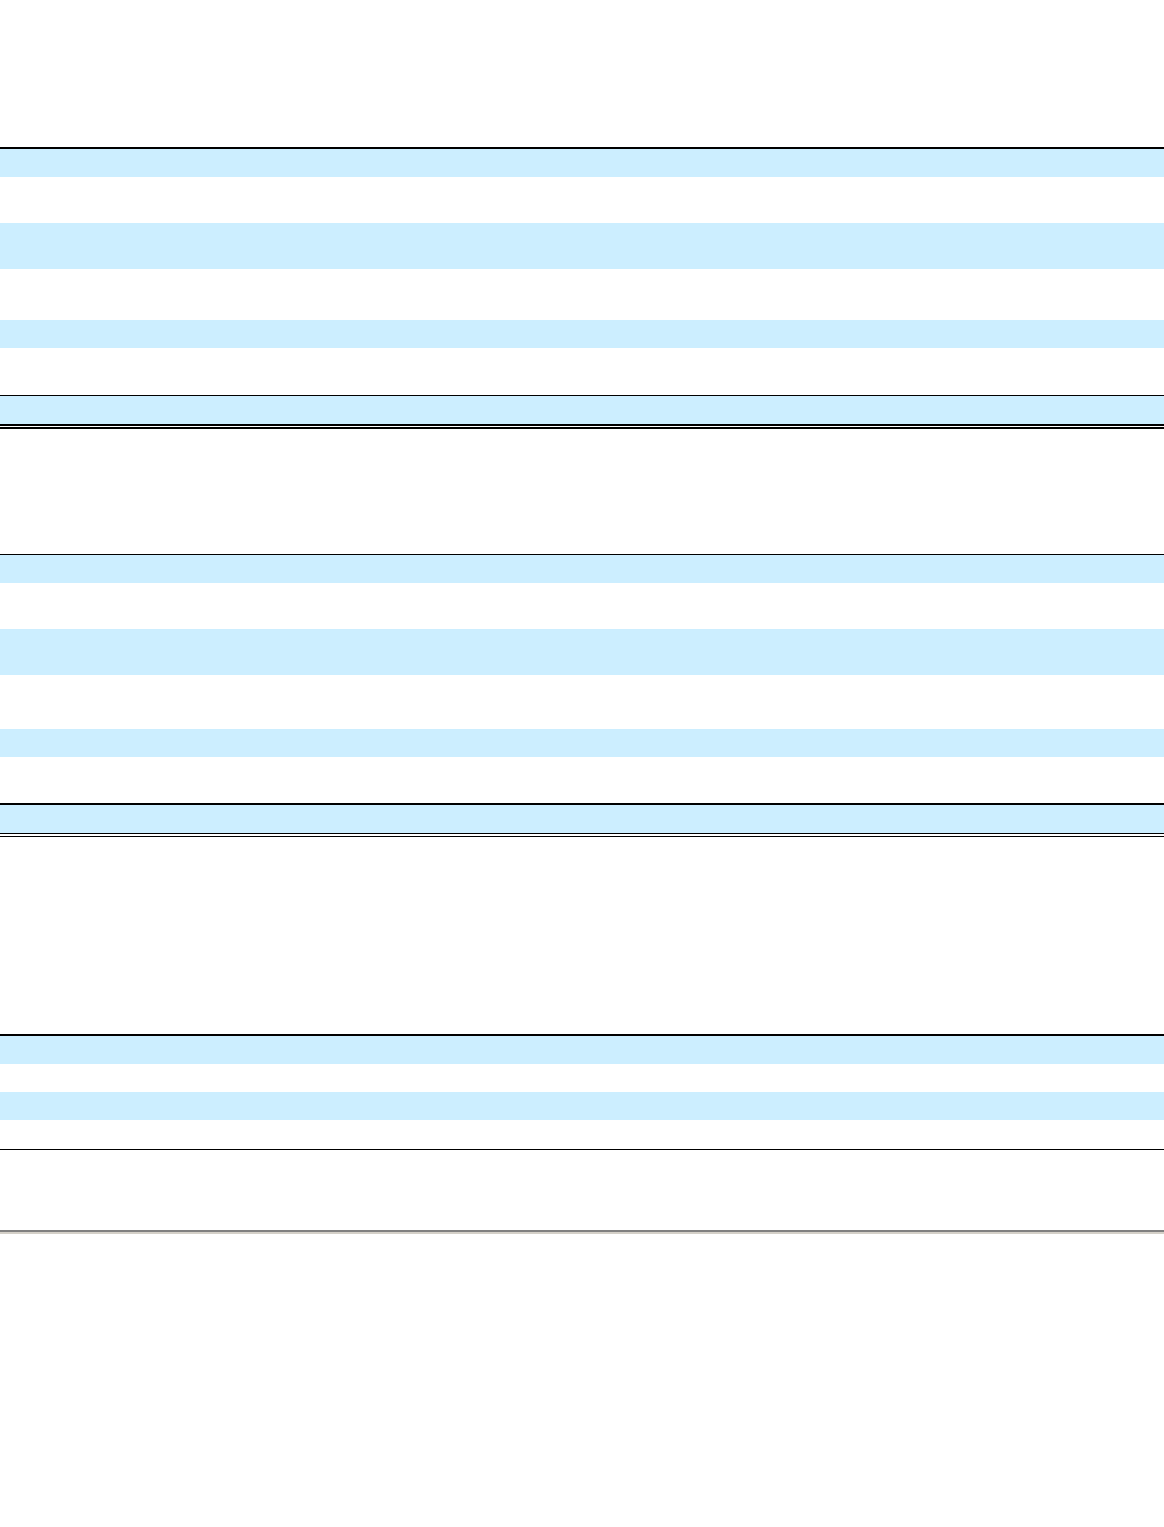
Offsetting Assets and Liabilities
We have master netting arrangements with all of our counterparties giving us the right of setoff. We have elected not to offset the fair value
positions recorded on our Consolidated Balance Sheets. The following table shows the potential net fair value positions had we elected to offset.
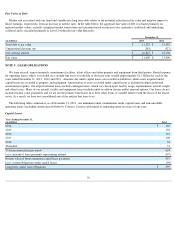
68
(in millions) Notional Balance Final
Maturity Date
Prepaid
Expenses and
Other Assets
Other
Noncurrent
Assets
Other
Accrued
Liabilities
Other
Noncurrent
Liabilities
Hedge
Derivatives,
net
Designated as hedges
Interest rate contracts (cash
flow hedges)
$
477
U.S. dollars May 2019
$
—
$
—
$
(
17
)
$
(26
)
$
(43
)
Interest rate contracts (fair
value hedges)
$
445
U.S. dollars August 2022
—
—
(
2
)
(22
)
(24
)
Foreign currency exchange
contracts
120,915
Japanese yen August 2016
157
100
—
—
257
438
Canadian dollars
Not designated as hedges
Fuel hedge contracts
4,077
gallons - crude oil, diesel
and jet fuel March 2015
428
29
(127
)
(16
)
314
Total derivative contracts
$
585
$
129
$
(146
)
$
(64
)
$
504
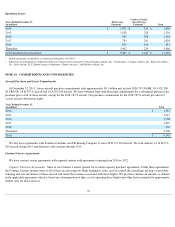
(in millions) Notional Balance Final
Maturity Date
Prepaid
Expenses and
Other Assets
Other
Noncurrent
Assets
Other
Accrued
Liabilities
Other
Noncurrent
Liabilities
Hedge
Derivatives,
net
Designated as hedges
Interest rate contracts (cash
flow hedges)
$
740
U.S. dollars May 2019
$
—
$
—
$
(
22
)
$
(48
)
$
(70
)
Interest rate contracts (fair
value hedges)
$
469
U.S. dollars August 2022
—
6
(2
)
—
4
Foreign currency exchange
contracts
119,277
Japanese yen December
2015
62
63
(1
)
(1
)
123
430
Canadian dollars
Not designated as hedges
Fuel contracts
1,792
gallons - heating oil,
crude oil and jet fuel December
2013
511
—
(
262
)
—
249
Total derivative contracts
$
573
$
69
$
(287
)
$
(49
)
$
306
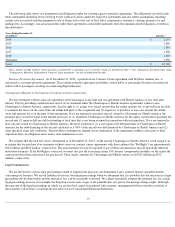
(in millions)
Prepaid
Expenses and
Other
Other
Noncurrent
Assets Other Accrued
Liabilities
Other
Noncurrent
Liabilities Hedge
Derivatives, Net
December 31, 2013
Net derivative contracts
$
456
$
116
$
(19
)
$
(49
)
$
504
December 31, 2012
Net derivative contracts
$
320
$
69
$
(34
)
$
(49
)
$
306