Dell 2010 Annual Report Download - page 79
Download and view the complete annual report
Please find page 79 of the 2010 Dell annual report below. You can navigate through the pages in the report by either clicking on the pages listed below, or by using the keyword search tool below to find specific information within the annual report.-
 1
1 -
2
-
3
-
4
-
5
-
6
-
7
-
8
-
9
-
10
-
11
-
12
-
13
-
14
-
15
-
16
-
17
-
18
-
19
-
20
-
21
-
22
-
23
-
24
-
25
-
26
-
27
-
28
-
29
-
30
-
31
-
32
-
33
-
34
-
35
-
36
-
37
-
38
-
39
-
40
-
41
-
42
-
43
-
44
-
45
-
46
-
47
-
48
-
49
-
50
-
51
-
52
-
53
-
54
-
55
-
56
-
57
-
58
-
59
-
60
-
61
-
62
-
63
-
64
-
65
-
66
-
67
-
68
-
 69
69 -
 70
70 -
 71
71 -
 72
72 -
 73
73 -
 74
74 -
 75
75 -
 76
76 -
 77
77 -
 78
78 -
 79
79 -
 80
80 -
 81
81 -
 82
82 -
 83
83 -
 84
84 -
 85
85 -
 86
86 -
 87
87 -
 88
88 -
 89
89 -
90
-
91
-
92
-
93
-
94
-
95
-
96
-
97
-
98
-
99
-
100
-
101
-
102
-
103
-
104
-
105
-
106
-
107
-
108
-
109
-
110
-
111
-
112
-
113
-
114
-
115
-
116
-
117
-
118
-
119
-
120
-
121
-
122
-
123
-
124
-
125
-
126
-
127
-
128
-
129
-
130
-
131
-
132
-
133
-
134
-
135
-
136
-
137
-
138
-
139
-
140
-
141
-
142
-
143
-
144
-
145
-
146
-
147
-
148
-
149
-
150
-
151
-
152
-
153
-
154
 |
 |

Table of Contents
DELL INC.
NOTES TO CONSOLIDATED FINANCIAL STATEMENTS (Continued)
January 28, 2011
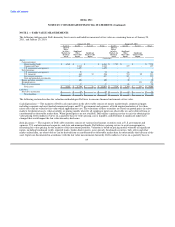
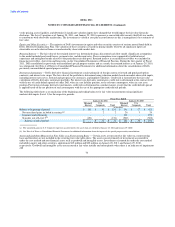
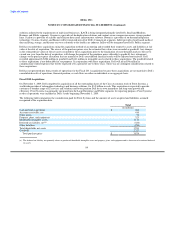
Investment Non-Investment Sub-Standard Total
(in millions)
Fixed — Large Enterprise
Owned since inception $ 806 $ 166 $ 159 $ 1,131
Fixed — Public
Owned since inception $ 438 $ 30 $ 8 $ 476
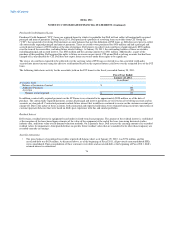
For the Large Enterprise and Public commercial receivables shown above, Dell's internal credit level scoring has been aggregated to their
most comparable external commercial rating agency equivalents. Investment grade accounts are generally of the highest credit quality,
non-investment grade represents middle quality accounts, and sub-standard represents the lowest quality accounts.
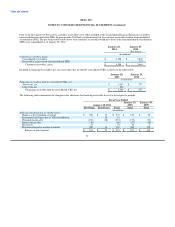
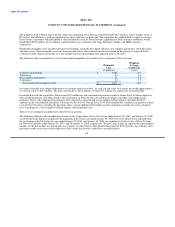
January 28, 2011
Higher Mid Lower Total
(in millions)
Revolving — SMB
Owned since inception $ 108 $ 85 $ 84 $ 277
Purchased $ 16 $ 24 $ 6 $ 46
Fixed — SMB
Owned since inception $ 62 $ 129 $ 194 $ 385
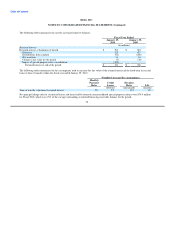
For SMB receivables in the above table, the Higher category includes Dell's top two internal credit levels, which generally have the
lowest loss experience, Mid includes credit levels three and four, and Lower includes Dell's bottom two credit levels, which experience
higher loss rates. For the SMB classes, fixed and revolving products are typically sold to different types of customers. The revolving
product is sold primarily to small business customers and the fixed products are more weighted toward medium-sized businesses.
Although both fixed and revolving products rely on a six-level internal rating system, the grading criteria and classifications are different
as the loss performance varies between these products and customer sets. Therefore, the credit levels are not comparable between the
SMB fixed and revolving classes.
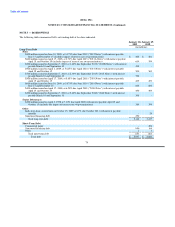
Customer Receivables
The following is the description of the components of Dell's customer receivables:
• Revolving loans — Revolving loans offered under private label credit financing programs provide qualified customers with a
revolving credit line for the purchase of products and services offered by Dell. Revolving loans bear interest at a variable annual
percentage rate that is tied to the prime rate. Based on historical payment patterns, revolving loan transactions are typically repaid
within 12 months on average. Revolving loans are included in short-term financing receivables. From time to time, account
holders may have the opportunity to finance their Dell purchases with special programs during which, if the outstanding balance is
paid in full by a specific date, no interest is charged. These special programs generally range from 6 to 12 months. At January 28,
2011, and January 29, 2010, receivables under these special programs were $398 million and $442 million, respectively.
• Sales-type leases — Dell enters into sales-type lease arrangements with customers who desire lease financing. Leases with
business customers have fixed terms of generally two to four years. Future maturities of minimum lease payments at January 28,
2011 for Dell were as follows: Fiscal 2012 — $993 million; Fiscal 2013 — $638 million; Fiscal 2014 — $245 million; Fiscal 2015
and beyond — $30 million. Fixed-term loans are offered to qualified small businesses, large commercial accounts, governmental
organizations, and educational entities. 75