Dell 2010 Annual Report Download - page 108
Download and view the complete annual report
Please find page 108 of the 2010 Dell annual report below. You can navigate through the pages in the report by either clicking on the pages listed below, or by using the keyword search tool below to find specific information within the annual report.-
 1
1 -
2
-
3
-
4
-
5
-
6
-
7
-
8
-
9
-
10
-
11
-
12
-
13
-
14
-
15
-
16
-
17
-
18
-
19
-
20
-
21
-
22
-
23
-
24
-
25
-
26
-
27
-
28
-
29
-
30
-
31
-
32
-
33
-
34
-
35
-
36
-
37
-
38
-
39
-
40
-
41
-
42
-
43
-
44
-
45
-
46
-
47
-
48
-
49
-
50
-
51
-
52
-
53
-
54
-
55
-
56
-
57
-
58
-
59
-
60
-
61
-
62
-
63
-
64
-
65
-
66
-
67
-
68
-
69
-
70
-
71
-
72
-
73
-
74
-
75
-
76
-
77
-
78
-
79
-
80
-
81
-
82
-
83
-
84
-
85
-
86
-
87
-
88
-
89
-
90
-
91
-
92
-
93
-
94
-
95
-
96
-
97
-
 98
98 -
 99
99 -
 100
100 -
 101
101 -
 102
102 -
 103
103 -
 104
104 -
 105
105 -
 106
106 -
 107
107 -
 108
108 -
 109
109 -
 110
110 -
 111
111 -
 112
112 -
 113
113 -
 114
114 -
 115
115 -
 116
116 -
 117
117 -
 118
118 -
119
-
120
-
121
-
122
-
123
-
124
-
125
-
126
-
127
-
128
-
129
-
130
-
131
-
132
-
133
-
134
-
135
-
136
-
137
-
138
-
139
-
140
-
141
-
142
-
143
-
144
-
145
-
146
-
147
-
148
-
149
-
150
-
151
-
152
-
153
-
154
 |
 |

Table of Contents
DELL INC.
NOTES TO CONSOLIDATED FINANCIAL STATEMENTS (Continued)
the terms and conditions of the stock awards granted to employees. The dividend yield of zero is based on the fact that Dell has never
paid cash dividends and has no present intention to pay cash dividends.
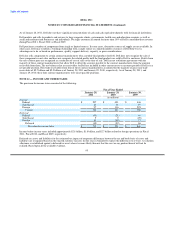
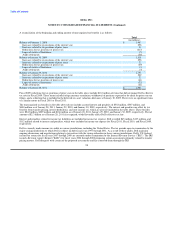
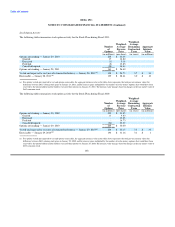
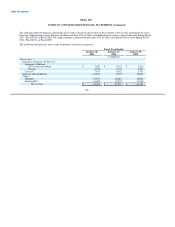
The weighted-average fair value of stock options was determined based on the Black-Scholes option pricing model weighted for all
grants utilizing the assumptions in the following table:
Fiscal Year Ended
January 28, January 29, January 30,
2011 2010 2009
Expected term (in years) 4.5 4.5 3.6
Risk-free interest rate (U.S. Government Treasury Note) 2.2% 1.8% 2.3%
Volatility 37% 44% 37%
Dividends -% -% -%
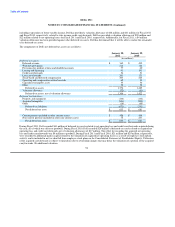
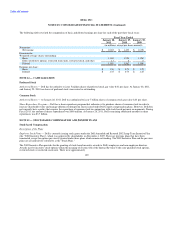
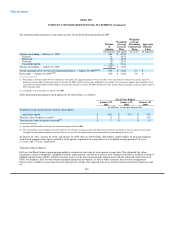
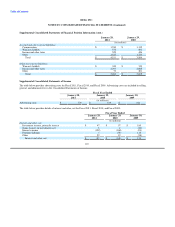
Restricted Stock Awards
Non-vested restricted stock awards and activities were as follows:
Fiscal 2011 Fiscal 2010 Fiscal 2009
Weighted- Weighted- Weighted-
Number Average Number Average Number Average
of Grant Date of Grant Date of Grant Date
Shares Fair Value Shares Fair Value Shares Fair Value
(in millions) (per share) (in millions) (per share) (in millions) (per share)
Non-vested restricted stock:
Beginning balance 40 $ 16.84 36 $ 22.45 36 $ 24.90
Granted 26 14.53 22 11.39 18 19.11
Vested(a) (17) 19.10 (13) 22.78 (10) 24.64
Forfeited (7) 15.21 (5) 18.23 (8) 23.15
Non-vested restricted stock ending balance 42 $ 14.71 40 $ 16.84 36 $ 22.45
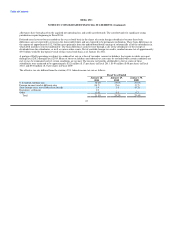
(a) Upon vesting, restricted stock units are generally sold to cover the required withholding taxes. However, select participants may choose the net shares settlement
method to cover withholding tax requirements. Total shares withheld were approximately 354,000, 157,000, and 48,000 for Fiscal 2011, Fiscal 2010, and Fiscal
2009, respectively. Total payments for the employee's tax obligations to the taxing authorities were $5 million, $2 million, and $1 million in Fiscal 2011, Fiscal
2010, and Fiscal 2009, respectively, and are reflected as a financing activity within the Consolidated Statements of Cash Flows.
For the Fiscal 2011, Fiscal 2010, and Fiscal 2009, total estimated vest date fair value of restricted stock awards was $250 million,
$134 million, and $197 million.
At January 28, 2011, January 29, 2010, and January 30, 2009, there was $341 million, $393 million, and $507 million, respectively, of
unrecognized stock-based compensation expense, net of estimated forfeitures, related to non-vested restricted stock awards. These awards
are expected to be recognized over a weighted-average period of approximately 1.9, 1.8, and 2.0 years, respectively.
104