Dell 2010 Annual Report Download - page 47
Download and view the complete annual report
Please find page 47 of the 2010 Dell annual report below. You can navigate through the pages in the report by either clicking on the pages listed below, or by using the keyword search tool below to find specific information within the annual report.-
 1
1 -
2
-
3
-
4
-
5
-
6
-
7
-
8
-
9
-
10
-
11
-
12
-
13
-
14
-
15
-
16
-
17
-
18
-
19
-
20
-
21
-
22
-
23
-
24
-
25
-
26
-
27
-
28
-
29
-
30
-
31
-
32
-
33
-
34
-
35
-
36
-
 37
37 -
 38
38 -
 39
39 -
 40
40 -
 41
41 -
 42
42 -
 43
43 -
 44
44 -
 45
45 -
 46
46 -
 47
47 -
 48
48 -
 49
49 -
 50
50 -
 51
51 -
 52
52 -
 53
53 -
 54
54 -
 55
55 -
 56
56 -
 57
57 -
58
-
59
-
60
-
61
-
62
-
63
-
64
-
65
-
66
-
67
-
68
-
69
-
70
-
71
-
72
-
73
-
74
-
75
-
76
-
77
-
78
-
79
-
80
-
81
-
82
-
83
-
84
-
85
-
86
-
87
-
88
-
89
-
90
-
91
-
92
-
93
-
94
-
95
-
96
-
97
-
98
-
99
-
100
-
101
-
102
-
103
-
104
-
105
-
106
-
107
-
108
-
109
-
110
-
111
-
112
-
113
-
114
-
115
-
116
-
117
-
118
-
119
-
120
-
121
-
122
-
123
-
124
-
125
-
126
-
127
-
128
-
129
-
130
-
131
-
132
-
133
-
134
-
135
-
136
-
137
-
138
-
139
-
140
-
141
-
142
-
143
-
144
-
145
-
146
-
147
-
148
-
149
-
150
-
151
-
152
-
153
-
154
 |
 |

Table of Contents
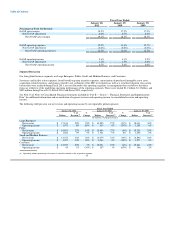
areas of marketing, servicing, and pricing of consumer credit accounts. The changes have not substantially altered how consumer credit is
offered to our customers or how their accounts are serviced. We do not believe that the impact of these changes is material to our
financial results.
See Note 4 of Notes to Consolidated Financial Statements included in "Part II — Item 8 — Financial Statements and Supplementary
Data" for additional information about our financing receivables and the associated allowance.
OFF-BALANCE SHEET ARRANGEMENTS
With the consolidation of our previously nonconsolidated special purpose entities, we no longer have off-balance sheet financing
arrangements.
MARKET RISK
We are exposed to a variety of risks, including foreign currency exchange rate fluctuations and changes in the market value of our
investments. In the normal course of business, we employ established policies and procedures to manage these risks.
Foreign Currency Hedging Activities
During Fiscal 2011, the principal foreign currencies in which we transacted business were the Euro, Chinese Renminbi, British Pound,
Japanese Yen, Canadian Dollar, and Australian Dollar. Our objective in managing our exposures to foreign currency exchange rate
fluctuations is to reduce the impact of adverse fluctuations associated with foreign currency exchange rate changes on our earnings and
cash flows. Accordingly, we utilize foreign currency option contracts and forward contracts to hedge our exposure on forecasted
transactions and firm commitments for certain currencies. During Fiscal 2011, we hedged our exposures on more than 20 currencies. We
monitor our foreign currency exchange exposures to ensure the overall effectiveness of our foreign currency hedge positions. However,
there can be no assurance that our foreign currency hedging activities will continue to substantially offset the impact of fluctuations in
currency exchange rates on our results of operations and financial position in the future.
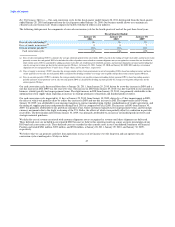
Based on our foreign currency cash flow hedge instruments outstanding at January 28, 2011 and January 29, 2010, we estimate a
maximum potential one-day loss in fair value of approximately $65 million and $86 million, respectively, using a Value-at-Risk ("VAR")
model. By using market implied rates and incorporating volatility and correlation among the currencies of a portfolio, the VAR model
simulates 3,000 randomly generated market prices and calculates the difference between the fifth percentile and the average as the
Value-at-Risk. The VAR model is a risk estimation tool and is not intended to represent actual losses in fair value that will be incurred.
Additionally, as we utilize foreign currency instruments for hedging forecasted and firmly committed transactions, a loss in fair value for
those instruments is generally offset by increases in the value of the underlying exposure.
Cash and Investments
At January 28, 2011, we had $15.1 billion of total cash, cash equivalents, and investments. The objective of our investment policy and
strategy is to manage our total cash and investments balances to preserve principal and maintain liquidity while maximizing the return on
the investment portfolio through the full investment of available funds. We diversify our investment portfolio by investing in multiple
types of investment-grade securities and through the use of third-party investment managers.
43