Dell 1997 Annual Report Download - page 14
Download and view the complete annual report
Please find page 14 of the 1997 Dell annual report below. You can navigate through the pages in the report by either clicking on the pages listed below, or by using the keyword search tool below to find specific information within the annual report.-
 1
1 -
2
-
3
-
 4
4 -
 5
5 -
 6
6 -
 7
7 -
 8
8 -
 9
9 -
 10
10 -
 11
11 -
 12
12 -
 13
13 -
 14
14 -
 15
15 -
 16
16 -
 17
17 -
 18
18 -
 19
19 -
 20
20 -
 21
21 -
 22
22 -
 23
23 -
 24
24 -
25
-
26
-
27
-
28
-
29
-
30
-
31
-
32
-
33
-
34
-
35
-
36
-
37
-
38
-
39
-
40
-
41
-
42
-
43
-
44
-
45
-
46
-
47
-
48
-
49
-
50
-
51
-
52
-
53
-
54
-
55
-
56
 |
 |
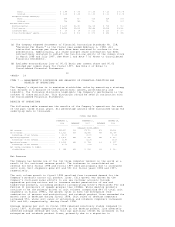
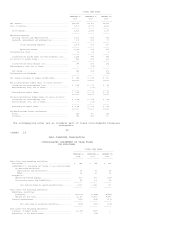
Operating Expenses
The following table presents certain information regarding the Company's
operating expenses during each of the last three fiscal years:
FISCAL YEAR ENDED
-----------------------------------------
FEBRUARY 1, FEBRUARY 2, JANUARY 28,
1998 1997 1996
----------- ----------- -----------
(DOLLARS IN MILLIONS)
Operating expenses:
Selling, general and administrative................... $1,202 $ 826 $ 595
Percentage of net revenue.......................... 9.8% 10.7% 11.3%
Research, development and engineering................. $ 204 $ 126 $ 95
Percentage of net revenue.......................... 1.6% 1.6% 1.8%
Total operating expenses................................ $1,406 $ 952 $ 690
Percentage of net revenue............................. 11.4% 12.3% 13.1%
Selling, general and administrative expenses increased in absolute dollar
amounts but declined as a percentage of net revenue for both fiscal 1998 and
1997. The increase in absolute dollars was due primarily to the Company's
increased staffing worldwide and increased infrastructure expenses, including
information systems, to support the Company's continued growth. The decline in
selling, general and administrative expense as a percentage of net revenue
resulted from significant net revenue growth.
The Company continues to fund research, development and engineering activities
to meet the demand for swift product cycles. As a result, research, development
and engineering expenses have increased each year in absolute dollars due to
increased staffing levels and product development costs. The Company expects to
continue to increase research, development and engineering spending in absolute
dollar amounts in order to invest in new products.
The Company believes that its ability to manage operating costs is an important
factor in its ability to remain competitive and successful. The Company will
continue to invest in information systems, personnel and other infrastructure,
and in research, development and engineering activities, to support its growth
and to provide for new, competitive products. Although operating expenses are
expected to increase in absolute dollar terms, the Company's goal is to manage
these expenses, over time, relative to its net revenue and gross margin.
Operating Income
While delivering annual revenue growth of 59% and 47% in fiscal years 1998 and
1997, respectively, the Company has grown operating income by 84% in fiscal 1998
and 90% in fiscal 1997. This reflects the Company's ability to manage operating
expenses in relation to growth in gross margin to deliver strong operating
performance.
Financing and Other
Financing and other increased $19 million in fiscal 1998 from fiscal 1997 to $52
million primarily as a result of increased investment income due to increased
average marketable securities balances. Also, financing and other increased $27
million in fiscal 1997 from fiscal 1996 to $33 million due to increased
investment income and decreased interest expense.
15
<PAGE> 17
Income Taxes
The Company's effective tax rate was 31% for fiscal 1998 compared to 29% for
both fiscal 1997 and 1996. The increase in the effective tax rate resulted from
changes in the geographical distribution of income and losses. As a result of
the Company's geographical distribution of income, the Company's effective tax
rate is lower than the U.S. federal statutory rate of 35%.
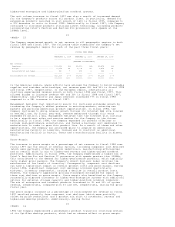
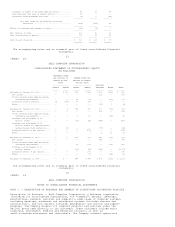
LIQUIDITY AND CAPITAL RESOURCES
The following table presents selected financial statistics and information for
each of the past three fiscal years:
FISCAL YEAR ENDED
-----------------------------------------
FEBRUARY 1, FEBRUARY 2, JANUARY 28,
1998 1997 1996
----------- ----------- -----------
(DOLLARS IN MILLIONS)
Cash and marketable securities......................... $1,844 $1,352 $ 646
Working capital........................................ $1,215 $1,089 $1,018
Days of sales in accounts receivable................... 36 37 42
Days of supply in inventory............................ 7 13 31