Dell 1997 Annual Report Download - page 13
Download and view the complete annual report
Please find page 13 of the 1997 Dell annual report below. You can navigate through the pages in the report by either clicking on the pages listed below, or by using the keyword search tool below to find specific information within the annual report.-
 1
1 -
2
-
 3
3 -
 4
4 -
 5
5 -
 6
6 -
 7
7 -
 8
8 -
 9
9 -
 10
10 -
 11
11 -
 12
12 -
 13
13 -
 14
14 -
 15
15 -
 16
16 -
 17
17 -
 18
18 -
 19
19 -
 20
20 -
 21
21 -
 22
22 -
 23
23 -
24
-
25
-
26
-
27
-
28
-
29
-
30
-
31
-
32
-
33
-
34
-
35
-
36
-
37
-
38
-
39
-
40
-
41
-
42
-
43
-
44
-
45
-
46
-
47
-
48
-
49
-
50
-
51
-
52
-
53
-
54
-
55
-
56
 |
 |
higher-end enterprise and higher-platform notebook systems.
The unit volume increase in fiscal 1997 was also a result of increased demand
for the Company's products across all product lines. In particular, demand for
enterprise products resulted in unit growth of 160% in fiscal 1997, compared to
a 37% decrease in units in fiscal 1996. Additionally in fiscal 1997, the Company
continued to introduce products utilizing latest technology, including products
incorporating Intel's Pentium and Pentium Pro processors with speeds at the
200MHz level.
13
<PAGE> 15
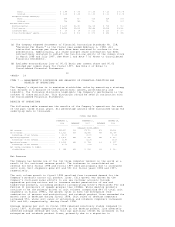
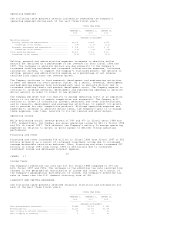
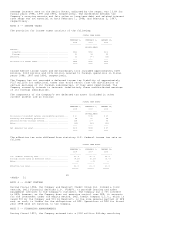
The Company experienced growth in net revenue in all geographic regions in both
fiscal 1998 and fiscal 1997. The following table summarizes the Company's net
revenue by geographic region for each of the past three fiscal years:
FISCAL YEAR ENDED
----------------------------------------------------------
FEBRUARY 1, 1998 FEBRUARY 2, 1997 JANUARY 28, 1996
---------------- ----------------- -----------------
(DOLLARS IN MILLIONS)
Net revenue:
Americas............................... $ 8,531 69% $5,279 68% $3,474 66%
Europe................................. 2,956 24 2,004 26 1,478 28
Asia-Pacific and Japan................. 840 7 476 6 344 6
------- ---- ------ ---- ------ ----
Consolidated net revenue................. $12,327 100% $7,759 100% $5,296 100%
======= ==== ====== ==== ====== ====
In the Americas region, where efforts have allowed the Company to build valuable
supplier and customer relationships, net revenue grew 62% and 52% in fiscal 1998
and fiscal 1997, respectively. In the European region, substantially all
countries experienced revenue growth in both fiscal 1998 and fiscal 1997. This
allowed Europe to increase revenue 48% and 36% in fiscal 1998 and fiscal 1997,
respectively. Asia-Pacific and Japan revenues increased 77% in fiscal 1998
compared to a 38% increase in fiscal 1997.
Management believes that opportunity exists for continued worldwide growth by
increasing the Company's market presence in existing markets, entering new
markets and pursuing additional product opportunities. In fiscal 1998, the
Company continued to drive revenue growth through its Internet Web site located
at www.dell.com. By fiscal year-end, revenue generated through this venue
exceeded $4 million a day. Management believes that the Internet will continue
to be a significant sales and service medium for the Company in the future.
Additionally in fiscal 1998, the Company expanded its product offerings to
include high-performance workstations, and formed a business unit dedicated to
workstations in order to grow this product line. As a result of these and other
opportunities, the Company has announced plans to acquire an additional
manufacturing facility in Limerick, Ireland and to construct an additional
manufacturing facility in Austin, Texas and a manufacturing facility in Xiamen,
China.
Gross Margin
The increase in gross margin as a percentage of net revenue in fiscal 1998 over
fiscal 1997 was the result of several factors, including component cost declines
(which were partially offset by price reductions), manufacturing efficiencies
and an overall shift in mix to higher-end servers and higher-priced notebook
platforms. Additionally in fiscal 1998, the Company experienced a higher mix of
Intel's Pentium Pro and Pentium II processors with speeds greater than 200MHz.
This contributed to the demand for higher-performance products, which typically
carry higher gross margins. The Company's direct business model involves the
maintenance of low levels of inventory. Consequently, component cost declines
can have a significant impact on overall product costs and gross margin. During
fiscal 1998, significant component cost declines occurred (particularly
mid-year, in memory components), causing a decline in overall product costs.
However, the Company's aggressive pricing strategies mitigated the impact of
these cost declines on gross margin. Gross margin also benefited as the Company
successfully migrated customers to higher-end enterprise systems with additional
options for external storage capacity and higher-platform notebook computers.
The mix of enterprise and notebook products increased to 9% and 20% of system
revenue, respectively, compared with 4% and 18%, respectively, during the prior
fiscal year.
The gross margin increase as a percentage of consolidated net revenue in fiscal
1997 resulted primarily from component cost declines (which were partially
offset by price reductions) and a product mix shift to notebooks, servers and
higher-end desktop products. Additionally, during fiscal
14
<PAGE> 16
1996 the Company experienced a problematic product transition involving certain
of its OptiPlex desktop products, which had an adverse effect on gross margin.