Creative 2007 Annual Report Download - page 16
Download and view the complete annual report
Please find page 16 of the 2007 Creative annual report below. You can navigate through the pages in the report by either clicking on the pages listed below, or by using the keyword search tool below to find specific information within the annual report.-
 1
1 -
2
-
3
-
4
-
5
-
 6
6 -
 7
7 -
 8
8 -
 9
9 -
 10
10 -
 11
11 -
 12
12 -
 13
13 -
 14
14 -
 15
15 -
 16
16 -
 17
17 -
 18
18 -
 19
19 -
 20
20 -
 21
21 -
 22
22 -
 23
23 -
 24
24
 |
 |

16
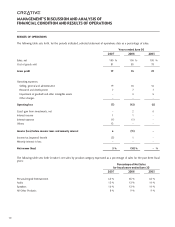
Unaudited data for quarters ended (as a percentage of sales)
Jun 30 Mar 31 Dec 31 Sep 30 Jun 30 Mar 31 Dec 31 Sep 30
2007 2007 2006 2006 2006 2006 2005 2005
Sales, net 100 % 100 % 100 % 100 % 100 % 100 % 100 % 100 %
Cost of goods sold 80 79 78 85 86 105 78 80
Gross profit (loss) 20 21 22 15 14 (5) 22 20
Operating Expenses:
Selling, general and
administrative 22 24 16 17 18 23 14 16
Research and development 9 10 5 7 7 8 6 7
Impairment of goodwill and other
intangible assets – – – – – 14 – –
Other charges – – – – – 3 – –
Operating (loss) income (11) (13) 1 (9) (11) (53) 2 (3)
(Loss) gain from investments, net – (1) – (1) – 1 2 4
Interest income 1 2 1 1 1 1 – –
Interest expense (1) (2) (1) (1) (1) (1) (1) (1)
Others 2 2 33 1 2 1 (1) –
(Loss) income before income
taxes and minority interest (9) (12) 34 (9) (9) (51) 2 –
Income tax (expense) benefit (3) (1) (6) – 3 – – –
Minority interest in loss (income) – – – – – – – –
Net (loss) income (12) % (13) % 28 % (9) % (6) % (51) % 2 % – %
MANAGEMENT’S DISCUSSION AND ANALYSIS OF
FINANCIAL CONDITION AND RESULTS OF OPERATIONS
LIQUIDITY AND CAPITAL RESOURCES
Cash and cash equivalents at June 30, 2007 were $250.5 million compared to the balance of $214.0 million at June 30, 2006.
Operating Activities
Net cash provided by operating activities during fiscal year 2007 was $132.2 million compared with $48.9 million in fiscal year
2006. The cash provided by operating activities of $132.2 million was mainly contributed by gross license fees $100.0 million
received from Apple Inc., less tax of $18.0 million, a $35.2 million net decrease in accounts receivable and other assets and prepaid
expenses, a $100.0 million net decrease in inventory and a $12.4 million adjustment for non-cash items. The decrease in inventory
was in line with management’s intention to maintain a lower inventory balance. Cash provided by operating activities was offset
partially by a $45.9 million net decrease in accounts payable and accrued and other liabilities. The $12.4 million in adjustments to
non-cash items was mainly pertaining to $18.5 million of depreciation and amortization charges.
Net cash provided by operating activities during fiscal year 2006 was $48.9 million compared with $204.4 million used in fiscal
year 2005. The cash provided by operating activities of $48.9 million was mainly due to a $21.6 million net decrease in accounts
receivable and other assets and prepaid expenses, a $161.0 million net decrease in inventory and a $35.8 million adjustment for
non-cash items. The decrease in inventory was in line with management’s intention to maintain a lower inventory balance. Cash
provided by operating activities was offset partially by a $49.6 million net decrease in accounts payable and accrued and other