Creative 2007 Annual Report Download - page 13
Download and view the complete annual report
Please find page 13 of the 2007 Creative annual report below. You can navigate through the pages in the report by either clicking on the pages listed below, or by using the keyword search tool below to find specific information within the annual report.-
 1
1 -
2
-
 3
3 -
 4
4 -
 5
5 -
 6
6 -
 7
7 -
 8
8 -
 9
9 -
 10
10 -
 11
11 -
 12
12 -
 13
13 -
 14
14 -
 15
15 -
 16
16 -
 17
17 -
 18
18 -
 19
19 -
 20
20 -
 21
21 -
 22
22 -
 23
23 -
24
 |
 |

13
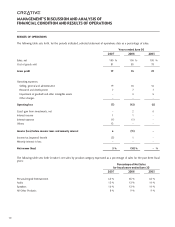
in fiscal year 2006 compared to 14% in fiscal year 2005. The decrease in audio product sales was mainly due to a decrease in
sales of low-end audio sound cards. Sales of speakers decreased by 12% in fiscal year 2006 compared to fiscal year 2005 and
represented 13% of sales in fiscal year 2006 compared to 14% in fiscal year 2005. The decrease was primarily attributable to
lower sales of non-multimedia speakers. Sales from all other products, which include graphics products, communication products,
accessories and other miscellaneous items, decreased by 16% compared to fiscal year 2005 and represented 9% of sales in fiscal
years 2006 and 2005. The decrease was primarily attributable to decreases in sales of graphics and communication products.
Gross profit
Gross profit in fiscal year 2006 was 15% of sales compared to 22% in fiscal year 2005. The decrease in gross profit was primarily
attributable to a substantial write-down of flash memory inventory amounting to $19.0 million in the third quarter of fiscal year
2006 due to a drop in the flash memory prices. The drop in flash memory prices caused market uncertainty that resulted in lower
sales and reductions in the selling prices of digital audio players, which negatively impacted gross profit.
Operating expenses
SG&A expenses in fiscal year 2006 decreased marginally by 1% compared to fiscal year 2005. As a percentage of sales, SG&A
expenses were 18% of sales compared to 16% of sales in fiscal year 2005.
R&D expenses decreased by 6% compared to fiscal year 2005. As a percentage of sales, R&D expenses were 7% of sales in fiscal
years 2006 and 2005.
In fiscal year 2006, there was a change in the business strategy of 3Dlabs to refocus on the portable handheld device market instead
of the professional workstation graphics business. As a result, the fair value of 3Dlabs could no longer support the carrying value
of the goodwill and other intangible assets associated with the acquisition of 3Dlabs in May 2002. Accordingly, Creative recorded
a $31.5 million impairment of goodwill and other intangible assets in fiscal year 2006. See Note 3 of “Notes to Consolidated
Financial Statements.”
The impairment of goodwill and intangible assets charge of $65.2 million in fiscal year 2005 resulted from a review of the goodwill
and intangible assets of 3Dlabs during the second quarter of fiscal year 2005. During the second quarter of fiscal year 2005,
management noted that the revenue of 3Dlabs continued to perform below expectations due to delays in the launch of new products.
Therefore, in accordance with SFAS No. 142, an impairment test was performed by an independent assessor on the goodwill and
other intangible assets of 3Dlabs. The fair value was determined based on a combination of the projected discounted cash flow
method and the market comparable method whereby market multiples of 3Dlabs were compared to the market multiples of other
publicly traded companies in similar lines of business. The conclusion of the impairment review was that the fair value of 3Dlabs
could no longer support the carrying value of the remaining goodwill and other intangible assets associated with them. As a result,
Creative recorded goodwill and other intangible assets impairment charge of $65.2 million in fiscal year 2005.
Other charges of $5.9 million for fiscal year 2006 comprised mainly restructuring charges incurred by 3Dlabs due to the change in
business strategy. The restructuring charge comprised mainly employee severance costs and fixed assets impairment write-downs.
See Note 12 of “Notes to Consolidated Financial Statements.”
Net investment (loss) gain
Net investment gain of $18.9 million in fiscal year 2006 included a $20.9 million net gain from sales of investments offset by
$2.0 million in write-downs of investments. Net investment gain of $74.4 million in fiscal year 2005 comprised a $86.0 million
net gain from sales of investments offset by $11.6 million in write-downs of investments. The bulk of the net gain from the sales
of investments was derived from sales of shares of SigmaTel, Inc. (“SigmaTel”).
As part of its long-term business strategy, from time to time, Creative makes strategic equity investments in companies that can
provide Creative with technologies or products that management believes will give Creative a competitive advantage in the markets
in which Creative competes.