ComEd 2010 Annual Report Download - page 35
Download and view the complete annual report
Please find page 35 of the 2010 ComEd annual report below. You can navigate through the pages in the report by either clicking on the pages listed below, or by using the keyword search tool below to find specific information within the annual report.-
 1
1 -
2
-
3
-
4
-
5
-
6
-
7
-
8
-
9
-
10
-
11
-
12
-
13
-
14
-
15
-
16
-
17
-
18
-
19
-
20
-
21
-
22
-
23
-
24
-
 25
25 -
 26
26 -
 27
27 -
 28
28 -
 29
29 -
 30
30 -
 31
31 -
 32
32 -
 33
33 -
 34
34 -
 35
35 -
 36
36 -
 37
37 -
 38
38 -
 39
39 -
 40
40 -
 41
41 -
 42
42 -
 43
43 -
 44
44
 |
 |

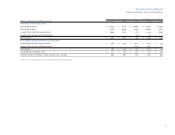
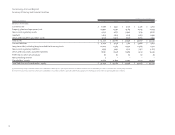
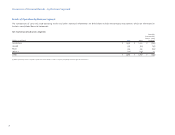
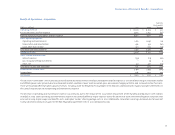
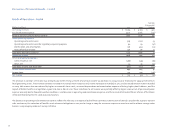
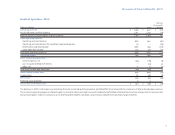
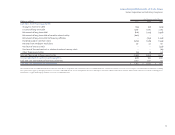
Consolidated Statements of Operations and Comprehensive Income
Exelon Corporation and Subsidiary Companies
For the years ended Dec. 31,
(Dollars in millions, except for per share data) 2010 2009 2008
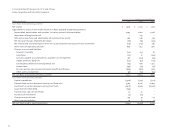
Other comprehensive income (loss)
Pension and non-pension postretirement benefit plans:
Prior service benefit reclassified to periodic costs, net of taxes of $(7), $(6) and $(6), respectively (11) (13) (9)
Actuarial loss reclassified to periodic cost, net of taxes of $79, $74 and $52, respectively 114 93 60
Transition obligation reclassified to periodic cost, net of taxes of $2, $2 and $2, respectively 3 3 3
Pension and non-pension postretirement benefit plan valuation adjustment,
net of taxes of $(188), $47 and $(959), respectively (288) 86 (1,459)
Change in unrealized gain (loss) on cash flow hedges, net of taxes of $(107), $(2) and $563, respectively (151) (12) 855
Change in unrealized gain (loss) on marketable securities, net of taxes of $0, $3 and $(6), respectively (1) 5 (7)
Other comprehensive income (loss) (334) 162 (557)
Comprehensive income $ 2,229 $ 2,869 $ 2,180
Average shares of common stock outstanding:
Basic 661 659 658
Diluted 663 662 662
Earnings per average common share – basic:
Income from continuing operations $ 3.88 $ 4.10 $ 4.13
Income from discontinued operations – – 0.03
Net income $ 3.88 $ 4.10 $ 4.16
Earnings per average common share – diluted:
Income from continuing operations $ 3.87 $ 4.09 $ 4.10
Income from discontinued operations – – 0.03
Net income $ 3.87 $ 4.09 $ 4.13
Dividends per common share $ 2.10 $ 2.10 $ 2.03
The information in the Consolidated Statements of Operations and Comprehensive Income shown above is a replication of the information in the Consolidated Statements of Operations in Exelon’s 2010 Form 10-K. For complete consolidated
financial statements, including notes, please refer to pages 150 through 331 of Exelon’s 2010 Form 10-K filed with the SEC. See also management’s discussion and analysis of financial condition and results of operation, which includes a discussion
of critical accounting policies and estimates, on pages 63 through 133 of Exelon’s 2010 Form 10-K filed with the SEC.
33