ComEd 2010 Annual Report Download - page 27
Download and view the complete annual report
Please find page 27 of the 2010 ComEd annual report below. You can navigate through the pages in the report by either clicking on the pages listed below, or by using the keyword search tool below to find specific information within the annual report.-
 1
1 -
2
-
3
-
4
-
5
-
6
-
7
-
8
-
9
-
10
-
11
-
12
-
13
-
14
-
15
-
16
-
 17
17 -
 18
18 -
 19
19 -
 20
20 -
 21
21 -
 22
22 -
 23
23 -
 24
24 -
 25
25 -
 26
26 -
 27
27 -
 28
28 -
 29
29 -
 30
30 -
 31
31 -
 32
32 -
 33
33 -
 34
34 -
 35
35 -
 36
36 -
 37
37 -
38
-
39
-
40
-
41
-
42
-
43
-
44
 |
 |
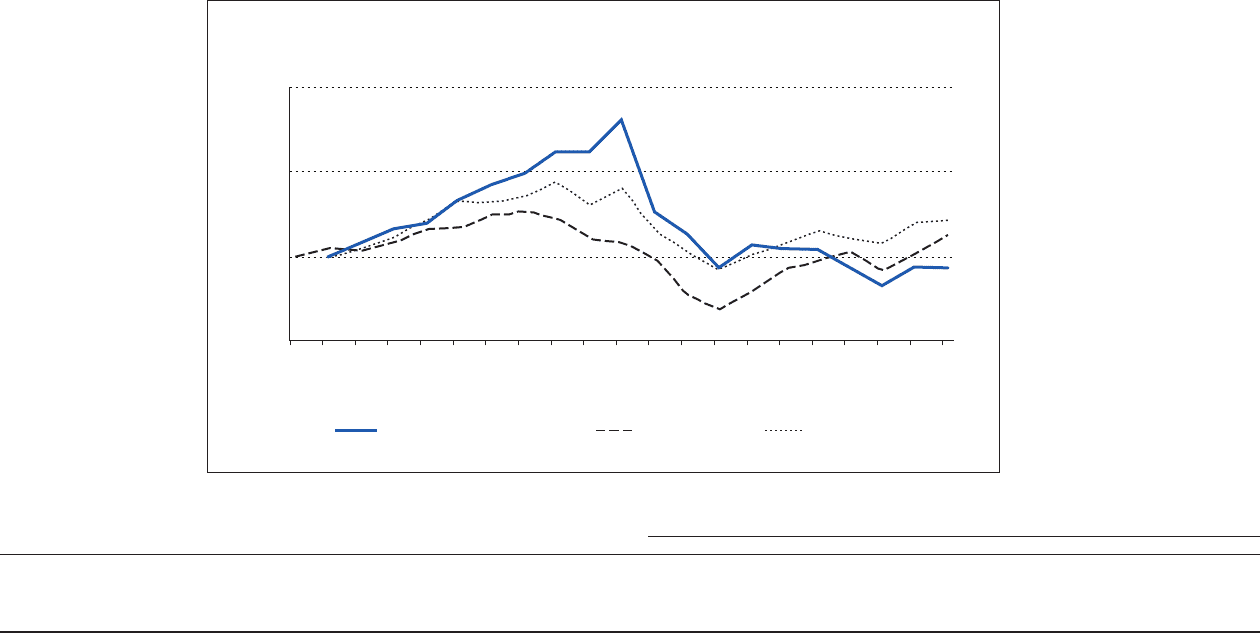
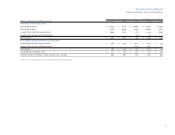
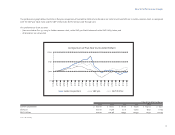
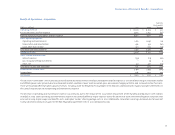
Stock Performance Graph
The performance graph below illustrates a five-year comparison of cumulative total returns based on an initial investment of $100 in Exelon common stock, as compared
with the S&P 500 Stock Index and the S&P Utility Index for the period 2006 through 2010.
This performance chart assumes:
• $100 invested on Dec. 31, 2005, in Exelon common stock, in the S&P 500 Stock Index and in the S&P Utility Index; and
• All dividends are reinvested.
Value of investment at Dec. 31,
2005 2006 2007 2008 2009 2010
Exelon Corporation $ 100.00 119.72 161.70 113.39 104.02 93.21
S&P 500 100.00 115.76 122.11 77.00 97.31 111.95
S&P Utilities 100.00 120.96 144.35 102.59 114.71 120.95
Source: Bloomberg
25
ComparisonofFive-YearCumulativeReturn
$0
$100
$150
$200
ExelonCorporation S&P500 S&PUtilities
12/05
3/06
6/06
9/06
12/06
3/07
6/07
9/07
12/07
3/08
6/08
9/08
12/08
3/09
6/09
9/09
12/09
3/10
6/10
9/10
12/10
$ $ $ $ $