ComEd 2010 Annual Report Download - page 25
Download and view the complete annual report
Please find page 25 of the 2010 ComEd annual report below. You can navigate through the pages in the report by either clicking on the pages listed below, or by using the keyword search tool below to find specific information within the annual report.-
 1
1 -
2
-
3
-
4
-
5
-
6
-
7
-
8
-
9
-
10
-
11
-
12
-
13
-
14
-
 15
15 -
 16
16 -
 17
17 -
 18
18 -
 19
19 -
 20
20 -
 21
21 -
 22
22 -
 23
23 -
 24
24 -
 25
25 -
 26
26 -
 27
27 -
 28
28 -
 29
29 -
 30
30 -
 31
31 -
 32
32 -
 33
33 -
 34
34 -
 35
35 -
36
-
37
-
38
-
39
-
40
-
41
-
42
-
43
-
44
 |
 |

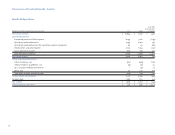
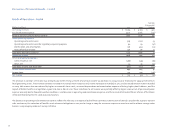
Summary Annual Report
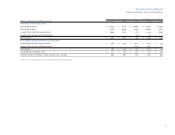
Summary of Earnings and Financial Condition
For the years ended Dec. 31,
(Dollars in millions, except for per share data) 2010 2009 2008 2007 2006
Statement of operations data:
Operating revenues $ 18,644 $ 17,318 $ 18,859 $ 18,916 $ 15,655
Operating income 4,726 4,750 5,299 4,668 3,521
Income from continuing operations 2,563 2,707 2,717 2,726 1,590
Income from discontinued operations – – 20 10 2
Net income (a) $ 2,563 $ 2,707 $ 2,737 $ 2,736 $ 1,592
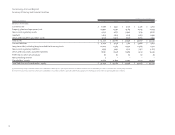
Earnings per average common share (diluted):
Income from continuing operations $ 3.87 $ 4.09 $ 4.10 $ 4.03 $ 2.35
Income from discontinued operations – – 0.03 0.02 –
Net income $ 3.87 $ 4.09 $ 4.13 $ 4.05 $ 2.35
Dividends per common share $ 2.10 $ 2.10 $ 2.03 $ 1.76 $ 1.60
Average shares of common stock outstanding – diluted 663 662 662 676 676
(a) The year 2006 reflects the impact of a goodwill impairment charge of $776 million.
23