Citrix 2006 Annual Report Download - page 2
Download and view the complete annual report
Please find page 2 of the 2006 Citrix annual report below. You can navigate through the pages in the report by either clicking on the pages listed below, or by using the keyword search tool below to find specific information within the annual report.-
 1
1 -
 2
2 -
 3
3 -
 4
4 -
 5
5 -
 6
6 -
 7
7 -
 8
8 -
 9
9 -
 10
10 -
 11
11 -
 12
12 -
 13
13 -
14
-
15
-
16
-
17
-
18
-
19
-
20
-
21
-
22
-
23
-
24
-
25
-
26
-
27
-
28
-
29
-
30
-
31
-
32
-
33
-
34
-
35
-
36
-
37
-
38
-
39
-
40
-
41
-
42
-
43
-
44
-
45
-
46
-
47
-
48
-
49
-
50
-
51
-
52
-
53
-
54
-
55
-
56
-
57
-
58
-
59
-
60
-
61
-
62
-
63
-
64
-
65
-
66
-
67
-
68
-
69
-
70
-
71
-
72
-
73
-
74
-
75
-
76
-
77
-
78
-
79
-
80
-
81
-
82
-
83
-
84
-
85
-
86
-
87
-
88
-
89
-
90
-
91
-
92
-
93
-
94
-
95
-
96
-
97
-
98
-
99
-
100
-
101
-
102
-
103
-
104
-
105
-
106
-
107
-
108
-
109
-
110
-
111
-
112
-
113
-
114
-
115
-
116
-
117
-
118
-
119
-
120
-
121
-
122
-
123
-
124
 |
 |

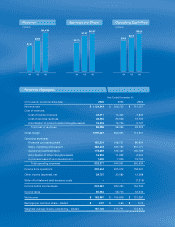
‘04 ‘05 ‘06
$741
$909
$1,134
‘04 ‘05 ‘06
$0.75
$0.93 $0.97
‘04 ‘05 ‘06
$265
$293
$329
Year Ended December 31,
(In thousands, except per share data) 2006 2005 2004
Net revenues $ 1,134,319 $ 908,722 $ 741,157
Cost of revenues:
Cost of license revenues 32,911 14,404 3,824
Cost of services revenues 46,585 26,929 16,705
Amortization of product related intangible assets 19,202 16,766 6,127
Total cost of revenues 98,698 58,099 26,656
Gross margin 1,035,621 850,623 714,501
Operating expenses:
Research and development 155,331 108,751 86,654
Sales, marketing and support 480,343 394,153 337,777
General and administrative 178,669 125,425 105,799
Amortization of other intangible assets 16,934 11,622 6,204
In-process research and development 1,000 7,000 19,100
Total operating expenses 832,277 646,951 555,534
Income from operations 203,344 203,672 158,967
Other income (expense), net 39,737 20,682 12,588
Write-off of deferred debt issuance costs – – (7,219)
Income before income taxes 243,081 224,354 164,336
Income taxes 60,084 58,745 33,049
Net income $ 182,997 $ 165,609 $ 131,287
Earnings per common share - diluted $ 0.97 $ 0.93 $ 0.75
Weighted average shares outstanding - diluted 187,725 177,771 174,374
Financial Highlights
Revenue Earnings per Share Operating Cash Flow
( millions) ( millions)