Citrix 2006 Annual Report Download - page 14
Download and view the complete annual report
Please find page 14 of the 2006 Citrix annual report below. You can navigate through the pages in the report by either clicking on the pages listed below, or by using the keyword search tool below to find specific information within the annual report.
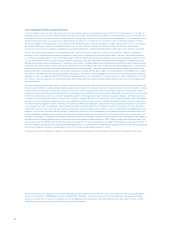
Year Ended December 31,
2003 2002
(In thousands, except per share data) (As reported) (Adjustments) (As restated) (As reported) (Adjustments) (As restated)
Consolidated Statements of
Income Data:
Net revenues $ 588,625 $ — $ 588,625 $ 527,448 $ — $ 527,448
Cost of revenues(a) 31,072 567 31,639 29,841 869 30,710
Gross margin 557,553 (567) 556,986 497,607 (869) 496,738
Operating expenses:
Research and development 64,443 1,923 66,366 68,923 4,541 73,464
Sales, marketing and support 252,749 5,773 258,522 235,393 10,521 245,914
General and administrative 85,672 1,524 87,196 88,946 3,405 92,351
Amortization of other
intangible assets 300 — 300 485 — 485
Total operating expenses 403,164 9,220 412,384 393,747 18,467 412,214
Income from operations 154,389 (9,787) 144,602 103,860 (19,336) 84,524
Interest income 21,120 — 21,120 30,943 — 30,943
Interest expense (18,280) (156) (18,436) (18,163) (105) (18,268)
Other income (expense), net 3,458 — 3,458 (3,483) — (3,483)
Income before income taxes 160,687 (9,943) 150,744 113,157 (19,441) 93,716
Income taxes 33,744 (3,042) 30,702 19,237 (5,836) 13,401
Net income $ 126,943 $ (6,901) $ 120,042 $ 93,920 $ (13,605) $ 80,315
Diluted earnings per share(b) $ 0.74 $ (0.04) $ 0.70 $ 0.52 $ (0.07) $ 0.45
Diluted weighted-average shares
outstanding(b) 171,447 (256) 171,191 179,359 (15) 179,344
(a) Cost of revenues includes amortization of product related intangible assets of $16.8 million, $6.1 million, $11.0 million and $10.8 million
in 2005, 2004, 2003 and 2002, respectively.
(b) Our diluted weighted–average shares outstanding primarily fluctuates based on the level of stock repurchases made under our stock
repurchase program and shares issued in connection with our acquisitions. See Notes 4 and 8 to our consolidated financial statements
included in this Annual Report.
The following adjusts our consolidated balance sheets
as of December 31, 2005, 2004, 2003 and 2002 for the
restatements as described in “Management’s Discussion
and Analysis of Financial Condition and Results of
Operations” and in Note 2 to our consolidated financial
statements included elsewhere in this Annual Report.


