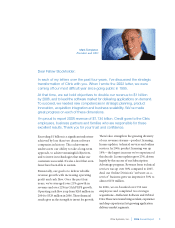
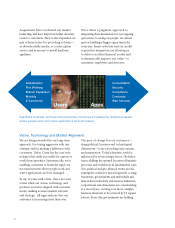
Citrix 2006 Annual Report Download - page 13
Download and view the complete annual report
Please find page 13 of the 2006 Citrix annual report below. You can navigate through the pages in the report by either clicking on the pages listed below, or by using the keyword search tool below to find specific information within the annual report.-
 1
1 -
2
-
 3
3 -
 4
4 -
 5
5 -
 6
6 -
 7
7 -
 8
8 -
 9
9 -
 10
10 -
 11
11 -
 12
12 -
 13
13 -
 14
14 -
 15
15 -
 16
16 -
 17
17 -
 18
18 -
 19
19 -
 20
20 -
 21
21 -
 22
22 -
 23
23 -
24
-
25
-
26
-
27
-
28
-
29
-
30
-
31
-
32
-
33
-
34
-
35
-
36
-
37
-
38
-
39
-
40
-
41
-
42
-
43
-
44
-
45
-
46
-
47
-
48
-
49
-
50
-
51
-
52
-
53
-
54
-
55
-
56
-
57
-
58
-
59
-
60
-
61
-
62
-
63
-
64
-
65
-
66
-
67
-
68
-
69
-
70
-
71
-
72
-
73
-
74
-
75
-
76
-
77
-
78
-
79
-
80
-
81
-
82
-
83
-
84
-
85
-
86
-
87
-
88
-
89
-
90
-
91
-
92
-
93
-
94
-
95
-
96
-
97
-
98
-
99
-
100
-
101
-
102
-
103
-
104
-
105
-
106
-
107
-
108
-
109
-
110
-
111
-
112
-
113
-
114
-
115
-
116
-
117
-
118
-
119
-
120
-
121
-
122
-
123
-
124
 |
 |

Citrix Systems, Inc. Annual Report
Year Ended December 31,
(In thousands) 2006 2005 2004 2003 2002
(Restated) (Restated) (Restated) (Restated)
Consolidated Balance Sheet Data(a):
Total assets $ 2,024,473 $ 1,698,982 $ 1,306,416 $ 1,369,768 $ 1,186,993
Current portion of long-term debt —— — 351,423 —
Stockholders’ equity 1,464,289 1,214,528 936,833 717,191 622,573
Long term debt —31,000 — — —
(a) For more information regarding the investigation of our historical stock option granting practices and the associated restatements, see
“Management’s Discussion and Analysis of Financial Condition and Results of Operations” and Note 2 to our consolidated financial
statements included elsewhere in this Annual Report.
(b) Cost of revenues includes amortization of product related intangible assets of $19.2 million, $16.8 million, $6.1 million, $11.0 million and
$10.8 million in 2006, 2005, 2004, 2003 and 2002, respectively.
(c) Our diluted weighted–average shares outstanding primarily fluctuates based on the level of stock repurchases made under our stock
repurchase program and shares issued in connection with our acquisitions. See Notes 4 and 8 to our consolidated financial statements
included in this Annual Report.
The following adjusts our consolidated income statements
for the years ended December 31, 2005, 2004, 2003 and
2002 for the restatements as described in “Management’s
Discussion and Analysis of Financial Condition and Results
of Operations” and in Note 2 to our consolidated financial
statements included elsewhere in this Annual Report.
Year Ended December 31,
2005 2004
(In thousands, except per share data) (As reported) (Adjustments) (As restated) (As reported) (Adjustments) (As restated)
Consolidated Statements of Income Data:
Net revenues $ 908,722 $ — $ 908,722 $ 741,157 $ — $ 741,157
Cost of revenues(a) 57,964 135 58,099 26,423 233 26,656
Gross margin 850,758 (135) 850,623 714,734 (233) 714,501
Operating expenses:
Research and development 108,687 64 108,751 86,357 297 86,654
Sales, marketing and support 393,420 733 394,153 337,566 211 337,777
General and administrative 125,538 (113) 125,425 106,516 (717) 105,799
Amortization of other intangible assets 11,622 — 11,622 6,204 — 6,204
In-process research and development 7,000 — 7,000 19,100 — 19,100
Total operating expenses 646,267 684 646,951 555,743 (209) 555,534
Income from operations 204,491 (819) 203,672 158,991 (24) 158,967
Interest income 23,614 — 23,614 14,274 — 14,274
Interest expense (2,229) (197) (2,426) (4,367) (170) (4,537)
Write-off of deferred debt issuance costs — — — (7,219) — (7,219)
Other income (expense), net (368) (138) (506) 2,754 97 2,851
Income before income taxes 225,508 (1,154) 224,354 164,433 (97) 164,336
Income taxes 59,168 (423) 58,745 32,887 162 33,049
Net income $ 166,340 $ (731) $ 165,609 $ 131,546 $ (259) $ 131,287
Diluted earnings per share(b) $ 0.93 $ — $ 0.93 $ 0.75 $ — $ 0.75
Diluted weighted-average shares outstanding(b) 178,036 (265) 177,771 174,734 (360) 174,374