Citrix 2006 Annual Report Download - page 16
Download and view the complete annual report
Please find page 16 of the 2006 Citrix annual report below. You can navigate through the pages in the report by either clicking on the pages listed below, or by using the keyword search tool below to find specific information within the annual report.
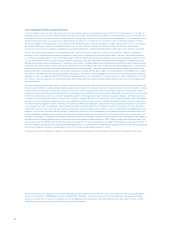
December 31, 2003 December 31, 2002
(As reported) (Adjustments) (As restated) (As reported) (Adjustments) (As restated)
Assets:
Current assets:
Cash and cash equivalents $ 182,969 $ — $ 182,969 $ 82,350 $ — $ 82,350
Short-term investments 385,431 — 385,431 95,780 — 95,780
Accounts receivable net of allowances 87,464 — 87,464 69,471 — 69,471
Prepaid expenses and other
current assets 58,167 — 58,167 36,400 — 36,400
Current portion of deferred
tax assets, net 51,540 3,848 55,388 49,515 4,852 54,367
Total current assets 765,571 3,848 769,419 333,516 4,852 338,368
Restricted cash equivalents and
investments 146,460 — 146,460 172,106 — 172,106
Long-term investments 183,411 — 183,411 369,168 — 369,168
Property and equipment, net 65,837 — 65,837 76,534 — 76,534
Goodwill, net 152,364 — 152,364 152,364 — 152,364
Other intangible assets, net 21,300 — 21,300 30,849 — 30,849
Long-term portion of deferred
tax assets, net 3,168 20,981 24,149 5,587 20,610 26,197
Other assets 6,828 — 6,828 21,407 — 21,407
Total Assets $ 1,344,939 $ 24,829 $ 1,369,768 $ 1,161,531 $ 25,462 $ 1,186,993
Liabilities:
Current liabilities:
Accounts payable $ 14,992 $ — $ 14,992 $ 11,913 $ — $ 11,913
Accrued expenses 93,966 14,436 108,402 73,768 17,479 91,247
Income taxes payable 5,498 — 5,498 793 — 793
Current portion of deferred revenues 152,938 — 152,938 95,963 — 95,963
Convertible subordinated debentures-
current 351,423 — 351,423 — — —
Total current liabilities 618,817 14,436 633,253 182,437 17,479 199,916
Long term portion of deferred revenues 12,137 — 12,137 8,028 — 8,028
Convertible subordinated debentures
long-term — — — 333,549 — 333,549
Other liabilities 7,187 — 7,187 6,452 — 6,452
Commitments and contingencies
Put warrants — — — 7,340 — 7,340
Common stock subject to repurchase — — — 9,135 — 9,135
Stockholders’ equity
Preferred stock at $.01 par value:
5,000 shares authorized — — — — — —
Common stock at $0.001 par value
1,000,000 shares authorized 203 — 203 197 — 197
Additional paid-in capital 700,111 143,967 844,078 595,959 139,821 735,780
Deferred compensation — (13,647) (13,647) — (18,812) (18,812)
Retained earnings 646,740 (119,927) 526,813 519,797 (113,026) 406,771
Accumulated other comprehensive
(loss) income 7,810 — 7,810 3,833 — 3,833
1,354,864 10,393 1,365,257 1,119,786 7,983 1,127,769
Less- common stock in treasury (648,066) — (648,066) (505,196) — (505,196)
Total stockholders’ equity 706,798 10,393 717,191 614,590 7,983 622,573
Total liabilities and
stockholders’ equity $ 1,344,939 $ 24,829 $ 1,369,768 $ 1,161,531 $ 25,462 $ 1,186,993


