Cathay Pacific 2009 Annual Report Download - page 20
Download and view the complete annual report
Please find page 20 of the 2009 Cathay Pacific annual report below. You can navigate through the pages in the report by either clicking on the pages listed below, or by using the keyword search tool below to find specific information within the annual report.
Review of Operations
PASSENGER SERVICES
%
40
50
60
70
80
90
%
0
20
40
60
80
100
HK cents
20
30
40
50
60
70
2005 2006 2007 2008 2009
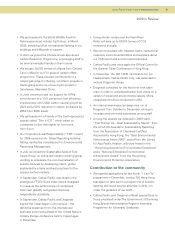
Load factor by region*
North Asia
Southwest
Pacific and
South Africa
Southeast
Asia and
Middle East
Europe North America 2005 2006 2007 2008 2009
Passenger load factor and yield*
Yield
Passenger load factor
*Includes Dragonair from 1st October 2006.
Cathay Pacific and Dragonair carried a total of 24.6 million passengers in 2009, a
decrease of 1.6% from the previous year. Demand, in particular for premium class
travel, was substantially reduced in the first three quarters of the year and we cut our
passenger capacity in response by 8% for Cathay Pacific and 13% for Dragonair from
May onwards. Revenue from passenger services fell by 20.8% to HK$45,920 million
while yield was reduced by 19.5% to HK51.1 cents. This principally reflected weak
demand from premium-class travellers, competitive pressure on economy class
yield, changing network traffic flows and, in the first half of the year, the strength
of the US dollar.
Available seat kilometres (“ASK”), load factor and yield by region for
Cathay Pacific and Dragonair passenger services for 2009 were as follows:
ASK (million) Load factor (%) Yield
2009 2008 Change 2009 2008 Change Change
Southwest Pacific and South Africa 17,959 17,689 +1.5% 80.8 77.0 +3.8%pt -21.6%
Europe 20,222 20,017 +1.0% 85.3 84.4 +0.9%pt -22.5%
North Asia 23,343 24,028 -2.9% 72.2 73.0 -0.8%pt -21.9%
Southeast Asia and Middle East 24,381 22,528 +8.2% 77.7 77.4 +0.3%pt -18.4%
North America 25,262 31,216 -19.1% 86.7 81.7 +5.0%pt -14.3%
Overall 111,167 115,478 -3.7% 80.5 78.8 +1.7%pt -19.5%
18


