Casio 2006 Annual Report Download - page 9
Download and view the complete annual report
Please find page 9 of the 2006 Casio annual report below. You can navigate through the pages in the report by either clicking on the pages listed below, or by using the keyword search tool below to find specific information within the annual report.-
 1
1 -
 2
2 -
 3
3 -
 4
4 -
 5
5 -
 6
6 -
 7
7 -
 8
8 -
 9
9 -
 10
10 -
 11
11 -
 12
12 -
 13
13 -
 14
14 -
 15
15 -
 16
16 -
 17
17 -
 18
18 -
 19
19 -
 20
20 -
21
-
22
-
23
-
24
-
25
-
26
-
27
-
28
-
29
-
30
-
31
-
32
-
33
-
34
-
35
-
36
-
37
-
38
-
39
-
40
-
41
-
42
-
43
-
44
-
45
-
46
 |
 |

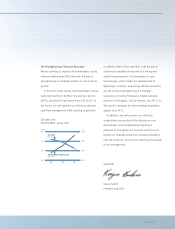
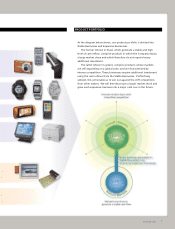
PRODUCT PORTFOLIO
As the diagram below shows, our product portfolio is divided into
Stable Businesses and Expansive Businesses.
The former (shown in blue), which generate a stable and high
level of cash infl ow, comprise products in which the Company enjoys
a large market share and which therefore do not require heavy
additional investment.
The latter (shown in green), comprise products whose markets
are still expanding on a global scale, and are characterized by
intense competition. These businesses require additional investment
using the cash infl ows from the Stable Businesses. If effectively
utilized, this will enable us to win out against the stiff competition
from other makers. We will thereby secure a larger market share and
grow each expansive business into a major cash cow in the future.
7
Annual Report 2006