Casio 2006 Annual Report Download - page 8
Download and view the complete annual report
Please find page 8 of the 2006 Casio annual report below. You can navigate through the pages in the report by either clicking on the pages listed below, or by using the keyword search tool below to find specific information within the annual report.-
 1
1 -
 2
2 -
 3
3 -
 4
4 -
 5
5 -
 6
6 -
 7
7 -
 8
8 -
 9
9 -
 10
10 -
 11
11 -
 12
12 -
 13
13 -
 14
14 -
 15
15 -
 16
16 -
 17
17 -
 18
18 -
 19
19 -
20
-
21
-
22
-
23
-
24
-
25
-
26
-
27
-
28
-
29
-
30
-
31
-
32
-
33
-
34
-
35
-
36
-
37
-
38
-
39
-
40
-
41
-
42
-
43
-
44
-
45
-
46
 |
 |

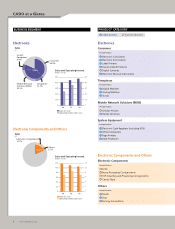
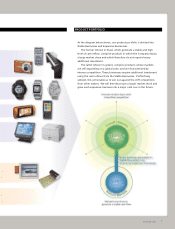
CASIO at a Glance
BUSINESS SEGMENT PRODUCT CATEGORY
Electronic Components and Others
Electronic Components and Others
Electronics
Sales and Operating Income
(Billions of yen)
00
100 10
200 20
300 30
400 40
500 50
04 05 06
Sales (left scale)
Operating income (right scale)
Sales and Operating Income
(Billions of yen)
00
20 2
40 4
60 6
80 8
100 10
120 12
04 05 06
Sales (left scale)
Operating income (right scale)
Sales
(%)
Electronic Components
12.7%
18.4%
Others
5.7%
Consumer
Principal Products
Electronic Calculators
Electronic Dictionaries
Label Printers
Visual-related Products
Digital Cameras
Electronic Musical Instruments
Electronic Components
Principal Products
LCDs
Bump Processing Consignments
TCP Assembly and Processing Consignments
Carrier Tape
Others
Principal Products
Molds
Toys
Factory Automation
Timepieces
Principal Products
Digital Watches
Analog Watches
Clocks
Mobile Network Solutions (MNS)
Principal Products
Cellular Phones
Handy Terminals
System Equipment
Principal Products
Electronic Cash Registers (including POS)
Offi ce Computers
Page Printers
Data Projectors
Electronics
Sales
(%)
System
Equipment
8.4%
Mobile Network
Solutions (MNS)
24.1%
Timepieces
12.3%
Consumer
36.8%
81.6%
Stable Business Expansive Business
6CASIO COMPUTER CO., LTD.