Casio 2006 Annual Report Download - page 3
Download and view the complete annual report
Please find page 3 of the 2006 Casio annual report below. You can navigate through the pages in the report by either clicking on the pages listed below, or by using the keyword search tool below to find specific information within the annual report.-
 1
1 -
 2
2 -
 3
3 -
 4
4 -
 5
5 -
 6
6 -
 7
7 -
 8
8 -
 9
9 -
 10
10 -
 11
11 -
 12
12 -
 13
13 -
 14
14 -
15
-
16
-
17
-
18
-
19
-
20
-
21
-
22
-
23
-
24
-
25
-
26
-
27
-
28
-
29
-
30
-
31
-
32
-
33
-
34
-
35
-
36
-
37
-
38
-
39
-
40
-
41
-
42
-
43
-
44
-
45
-
46
 |
 |

0
5,000
10,000
15,000
20,000
05040302 06
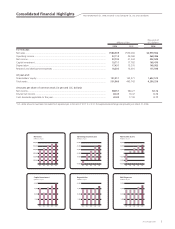
Capital Investment
(Millions of yen)
0
5,000
10,000
15,000
20,000
05040302 06
Depreciation
(Millions of yen)
-30,000
-20,000
-10,000
0
10,000
20,000
30,000
05040302 06
Net Income (Loss)
(Millions of yen)
0
5,000
10,000
15,000
20,000
05040302 06
R&D Expenses
(Millions of yen)
0
100,000
200,000
300,000
400,000
500,000
600,000
05040302 06
Net Sales
(Millions of yen)
-10,000
10,000
0
20,000
30,000
50,000
40,000
05040302 06
Operating Income (Loss)
(Millions of yen)
Consolidated Financial Highlights
Thousands of
Millions of Yen U.S. Dollars*
2006 2005 2006
For the year:
Net sales.............................................................................................................................. ¥580,309 ¥559,006 $4,959,906
Operating income................................................................................................................ 43,114 39,040 368,496
Net income.......................................................................................................................... 23,745 21,534 202,949
Capital investment............................................................................................................... 19,711 17,782 168,470
Depreciation ........................................................................................................................ 17,431 15,370 148,983
Research and development expenses ................................................................................... 18,205 16,616 155,598
At year-end:
Shareholders’ equity ............................................................................................................ 191,011 162,271 1,632,573
Total assets .......................................................................................................................... 501,960 495,743 4,290,256
Amounts per share of common stock (in yen and U.S. dollars):
Net income.......................................................................................................................... ¥88.57 ¥80.27 $0.76
Diluted net income .............................................................................................................. 84.43 76.47 0.72
Cash dividends applicable to the year................................................................................... 20.00 17.00 0.17
*U.S. dollar amounts have been translated from Japanese yen at the rate of ¥117 to U.S.$1, the approximate exchange rate prevailing on March 31, 2006.
Years ended March 31, 2006 and 2005 Casio Computer Co., Ltd. and Subsidiaries
1
Annual Report 2006