Canon 2008 Annual Report Download - page 3
Download and view the complete annual report
Please find page 3 of the 2008 Canon annual report below. You can navigate through the pages in the report by either clicking on the pages listed below, or by using the keyword search tool below to find specific information within the annual report.-
 1
1 -
 2
2 -
 3
3 -
 4
4 -
 5
5 -
 6
6 -
 7
7 -
 8
8 -
 9
9 -
 10
10 -
 11
11 -
 12
12 -
 13
13 -
 14
14 -
15
-
16
-
17
-
18
-
19
-
20
-
21
-
22
-
23
-
24
-
25
-
26
-
27
-
28
-
29
-
30
-
31
-
32
-
33
-
34
-
35
-
36
-
37
-
38
-
39
-
40
-
41
-
42
-
43
-
44
-
45
-
46
-
47
-
48
-
49
-
50
-
51
-
52
-
53
-
54
-
55
-
56
-
57
-
58
-
59
-
60
-
61
-
62
-
63
-
64
-
65
-
66
-
67
-
68
-
69
-
70
-
71
-
72
-
73
-
74
-
75
-
76
-
77
-
78
-
79
-
80
-
81
-
82
-
83
-
84
-
85
-
86
-
87
-
88
-
89
-
90
-
91
-
92
-
93
-
94
-
95
-
96
-
97
-
98
-
99
-
100
-
101
-
102
 |
 |

1
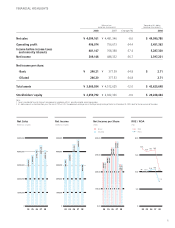
FINANCIAL HIGHLIGHTS
M
illions o
f
ye
n
(
except per share amounts
)
Thousands o
f
U.S. dollars
(
except per share amounts
)
2
008
200
7
C
han
g
e (%)
2
008
N
et sa
l
e
s
¥ 4
,09
4
,
1
6
1 ¥ 4
,
481
,
34
6
-8
.
6
$
44
,
990
,
78
0
Operatin
g
profi t4
96,0
7
4
75
6,6
7
3
-
3
4.4 5
,
451
,363
I
ncome be
f
ore income taxe
s
an
d
minority interest
s
481,14
7
7
68
,
388
-
3
7.4 5,287,33
0
Net
in
co
m
e
309
,14
8
4
88
,
332
-
36
.
7
3
,
39
7,
23
1
N
et income per s
h
are:
-
B
as
i
c
¥
2
4
6
.
2
1 ¥
3
77.
59
-
3
4.
8
$
2.71
-
Dilute
d
2
4
6
.
20
3
77.
53
-
3
4.
8
2
.71
Tota
l
assets
¥ 3,969,93
4
¥ 4,51
2
,
625
-1
2
.
0
$ 43,625,64
8
Stoc
kh
o
ld
ers’ equit
y
¥ 2
,
659
,
792 ¥ 2
,
922
,
33
6
-
9.0 $ 29
,
228
,
48
4
Notes:
1
. Canon’s consolidated
fi
nancial statements are prepared in accordance with U.S. generally accepted accounting principles
.
2. U.S. dollar amounts are translated from
y
en at the rate of JPY91=U.S.$1, the approximate exchan
g
e rate on the Tok
y
o Forei
g
n Exchan
g
e Market as of December 30, 2008, solel
y
for the convenience of the reader.
0
1,000,000
2,000,000
3,000,000
4,000,000
5,000,000
0
100,000
200,000
300,000
400,000
500,000
0.00
100.00
200.00
300.00
400.00
0
5.0
10.0
15.0
20.0
Net Sales
08
ROE / ROA
ROE
ROA
1
0
.1
1
0
.
8
7.
3
(Millions of yen) (%)
Net Income
(Millions of yen)
08 04 05 06 07 08
Basic
Diluted
Net Income per Share
(Yen)
08
1
0
.
6
04 05 06 07 04 05 06 07 04 05 06 07
1
6
.
8
16
.
0
16
.
3
16
.
5
11
.
1
9
9
9
09
09
09
0
0
0
,
,
4
4
4
4
4
4
1
1
1
6
6
6
6
6
6
1
1
1
1
1
,1
4
4
4,
4
4
4
8
8
8
,
7
7
7
6
6
6
6
6
6
4
4
4
4
4
,4
3
3
3
3
3
3
3
3
3
3
3
3
5
5
5
8
8
8
7
7
,7
3
3
3
3
3
3
1
1
1
1
1
1
9
9
9
1
1
1
1
1
1
4
4
4,
4
4
4
5
54
54
5
5
5
7
7
7
1
1
1
,
4
4
4
4
4
4
9
9
9
59
59
59
5
5
5
7
7
7
7
7
7
6
6
6,
6
6
6
5
5
5
5
5
5
1
1
1
81
81
81
8
8
8
4
4
4
4
4
4
4
4
4,
4
4
4
6
6
6
6
6
6
4
4
4
4
4
4
3
3
3
,
9
9
9,
9
9
9
0
0
0
30
30
30
3
3
3
8
8
8
4
48
48
4
4
4
1
1
1
1
,1
,
34
34
34
3
3
3
,
3
3
3
43
43
43
4
4
4
3
3
3
3
3
3
4
4
4
4
4
4
4
4
4
9
9
9
09
09
09
0
0
0
4
4
4,
4
4
4
84
84
84
8
8
8
3
3
3
3
3
3
6
6
6
6
6
6
5
5
5
4
4
4
4
4
4
55
55
55
5
5
5
,
3
3
3
32
32
32
2
2
2
5
5
5
5
5
5
8
8
8
8
8
8
8
8
8,
3
3
,3
3
3
3
3
3
3
32
32
32
2
2
2
48
48
48
4
4
4
2
2
2
2
2
2
5
5
5
5
5
5
8
8
8
8
8
8.
5
5
5
5
5
5
3
3
3
2
2
2
2
2
2
5
5
5
57
57
57
7
7
7
.
8
8
8
85
85
85
5
5
5
2
2
2
28
28
28
8
8
8
8
8
8
8
8
8
6
6
.6
6
6
6
3
3
3
3
3
3
2
2
2
28
28
28
8
8
8
8
8
8
8
8
8
3
3
.3
3
3
3
6
6
6
6
6
6
3
3
3
34
34
34
4
4
4
1
1
1
.
9
9
.9
9
9
9
5
5
5
5
5
5
3
3
3
34
34
34
4
4
4
1
1
1
.
8
8
.8
8
8
8
4
4
4
4
4
4
3
3
3
37
37
37
7
7
7
7
7
7
7
7
7.
5
5
5
5
5
5
9
9
9
9
9
9
3
3
3
37
37
37
7
7
7
7
7
7
7
7
7.
5
5
5
5
5
5
3
3
3
3
3
3
2
2
2
2
2
2
4
4
4
46
46
46
6
6
6
.
2
2
2
21
21
21
1
1
1
2
2
2
24
24
24
4
4
4
6
6
6
6
6
6
2
2
.2
2
2
2
0
0
0
0
0
0