Black & Decker 2015 Annual Report Download - page 4
Download and view the complete annual report
Please find page 4 of the 2015 Black & Decker annual report below. You can navigate through the pages in the report by either clicking on the pages listed below, or by using the keyword search tool below to find specific information within the annual report.-
 1
1 -
 2
2 -
 3
3 -
 4
4 -
 5
5 -
 6
6 -
 7
7 -
 8
8 -
 9
9 -
 10
10 -
 11
11 -
 12
12 -
 13
13 -
 14
14 -
 15
15 -
16
-
17
-
18
-
19
-
20
-
21
-
22
-
23
-
24
-
25
-
26
-
27
-
28
-
29
-
30
-
31
-
32
-
33
-
34
-
35
-
36
-
37
-
38
-
39
-
40
-
41
-
42
-
43
-
44
-
45
-
46
-
47
-
48
-
49
-
50
-
51
-
52
-
53
-
54
-
55
-
56
-
57
-
58
-
59
-
60
-
61
-
62
-
63
-
64
-
65
-
66
-
67
-
68
-
69
-
70
-
71
-
72
-
73
-
74
-
75
-
76
-
77
-
78
-
79
-
80
-
81
-
82
-
83
-
84
-
85
-
86
-
87
-
88
-
89
-
90
-
91
-
92
-
93
-
94
-
95
-
96
-
97
-
98
-
99
-
100
-
101
-
102
-
103
-
104
-
105
-
106
-
107
-
108
-
109
-
110
-
111
-
112
-
113
-
114
-
115
-
116
-
117
-
118
-
119
-
120
-
121
-
122
-
123
-
124
-
125
-
126
-
127
-
128
-
129
-
130
-
131
-
132
-
133
-
134
-
135
-
136
-
137
-
138
-
139
-
140
-
141
-
142
-
143
-
144
-
145
-
146
-
147
-
148
-
149
-
150
-
151
-
152
-
153
-
154
-
155
-
156
 |
 |

STANLEY BLACK & DECKER ANNUAL REPORT02
2015 Business Highlights
• Generated organic growth of %. Tools & Storage organic growth was
%, with above-market growth in all regions — North America (+%),
Europe (+%) and Emerging Markets (+%) — as share gains were powered
by innovative new product introductions, expanded retail partnerships,
e-commerce initiatives, commercial investments in developed markets,
and the success of our mid-price point products in emerging markets.
Engineered Fastening achieved % organic growth, led by its automotive
business and within Security, Europe posted % organic growth — its
best performance in years — while our North America mechanical locks
business grew % organically
• Improved the Company’s operating margin rate by basis points over
to .%, overcoming significant foreign currency headwinds.
Our focus on surgical price actions and cost control combined with
commodity deflation allowed us to realize strong operating leverage
in a challenging environment
• Posted a second consecutive year of record operating margin rates in
Tools & Storage and Engineered Fastening. The Tools & Storage operating
margin rate expanded basis points to .% and Engineered Fastening’s
rate ended in the high teens, up basis points
• Continued the successful release of mid-price point products across the
emerging markets. This initiative, now in its second year, helped deliver
organic growth in the emerging markets, most notably in Latin America
(+ %), in the face of dicult conditions in many of the markets we
serve. During the year we launched new power tool models and
significantly expanded the volume of our STANLEY branded oerings
within these markets
• Improved the Security business. The operating process enhancements
and leadership changes we made in our Security Europe business
generated improved operating results: % organic growth for the year
with five consecutive quarters of flat or positive organic growth, year-
over-year operating margin rate improvement each quarter with the rate
approaching % in the fourth quarter, strong orders, a healthy backlog,
and attrition well within our targeted range of %–%. Within North
America, our eorts to improve field eciency and upgrade operational
talent are taking hold, and we ended the year with an improving margin
trend in our commercial electronic security business along with strong
orders and a growing backlog. We also reinvigorated our mechanical
lock business, which grew mid-single digit organically and improved its
operating margin rate by over basis points
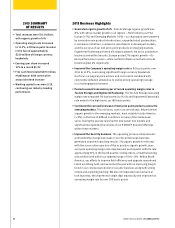
2015 SUMMARY
OF RESULTS
• Total revenues were $11.2 billion,
with organic growth of 6%
• Operating margin rate increased
to 14.2%, a 90 basis point increase
in the face of approximately
$220 million of foreign currency
headwinds
• Earnings per share increased
10% to a record $5.92
• Free cash flow totaled $871 million,
enabling our 48th consecutive
annual dividend increase
• Working capital turns were 9.2X,
continuing our industry-leading
performance