Black & Decker 2015 Annual Report Download - page 10
Download and view the complete annual report
Please find page 10 of the 2015 Black & Decker annual report below. You can navigate through the pages in the report by either clicking on the pages listed below, or by using the keyword search tool below to find specific information within the annual report.-
 1
1 -
 2
2 -
 3
3 -
 4
4 -
 5
5 -
 6
6 -
 7
7 -
 8
8 -
 9
9 -
 10
10 -
 11
11 -
 12
12 -
 13
13 -
 14
14 -
 15
15 -
 16
16 -
 17
17 -
 18
18 -
 19
19 -
 20
20 -
 21
21 -
22
-
23
-
24
-
25
-
26
-
27
-
28
-
29
-
30
-
31
-
32
-
33
-
34
-
35
-
36
-
37
-
38
-
39
-
40
-
41
-
42
-
43
-
44
-
45
-
46
-
47
-
48
-
49
-
50
-
51
-
52
-
53
-
54
-
55
-
56
-
57
-
58
-
59
-
60
-
61
-
62
-
63
-
64
-
65
-
66
-
67
-
68
-
69
-
70
-
71
-
72
-
73
-
74
-
75
-
76
-
77
-
78
-
79
-
80
-
81
-
82
-
83
-
84
-
85
-
86
-
87
-
88
-
89
-
90
-
91
-
92
-
93
-
94
-
95
-
96
-
97
-
98
-
99
-
100
-
101
-
102
-
103
-
104
-
105
-
106
-
107
-
108
-
109
-
110
-
111
-
112
-
113
-
114
-
115
-
116
-
117
-
118
-
119
-
120
-
121
-
122
-
123
-
124
-
125
-
126
-
127
-
128
-
129
-
130
-
131
-
132
-
133
-
134
-
135
-
136
-
137
-
138
-
139
-
140
-
141
-
142
-
143
-
144
-
145
-
146
-
147
-
148
-
149
-
150
-
151
-
152
-
153
-
154
-
155
-
156
 |
 |

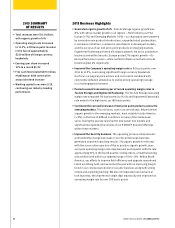
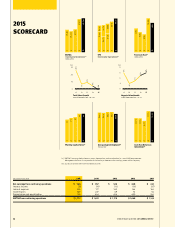
08 STANLEY BLACK & DECKER ANNUAL REPORT
MILLIONS OF DOLLARS 2015 2014 2013 2012 2011
Net earnings from continuing operations $ $ $ $ $
Interest income
Interest expense
Income taxes
Depreciation and amortization
EBITDA from continuing operations $ , $ , $ , $ , $ ,
Free Cash Flow(c)
$ MILLIONS
Cash Flow Return on
Investment(f)
(a) “ EBITDA” (earnings before interest, taxes, depreciation, and amortization) is a non-GAAP measurement.
Management believes it is important for the ability to determine the earnings power of the Company.
(b), (c), (d), (e) and (f) refer to the inside back cover.
EBITDA
(Continuing Operations)(a)
$ MILLIONS
15
$871
14
$1,005
13
$528
12
$593
11
$706
2015
SCORECARD
Working Capital Turns(d)
9.2
15
9.2
8.1
7.8
7.3
14131211
12.9%
14
.%
.%
.%
.%
15
20
(%)
30
12 13 14 15
-1%
26%
7%
9%
4%
Total Sales Growth
LONGTERM OBJECTIVE: +%
2
%
15
6%
%
%
%
%
Organic Sales Growth
LONGTERM OBJECTIVE: +%
$1,691
$1,170
$1,068
$1,145
15
$1,732
141311 12
Average Capital Employed(e)
$ BILLIONS
$10.0
15
$10.7
$10.5
$10.4
$10.7
14131211
EPS
(Continuing Operations)(b)
15
$5.92
$5.37
$4.98
$4.72
$3.28
$2.75
12 13
$3.60 $4.65