Berkshire Hathaway 2012 Annual Report Download - page 77
Download and view the complete annual report
Please find page 77 of the 2012 Berkshire Hathaway annual report below. You can navigate through the pages in the report by either clicking on the pages listed below, or by using the keyword search tool below to find specific information within the annual report.-
 1
1 -
2
-
3
-
4
-
5
-
6
-
7
-
8
-
9
-
10
-
11
-
12
-
13
-
14
-
15
-
16
-
17
-
18
-
19
-
20
-
21
-
22
-
23
-
24
-
25
-
26
-
27
-
28
-
29
-
30
-
31
-
32
-
33
-
34
-
35
-
36
-
37
-
38
-
39
-
40
-
41
-
42
-
43
-
44
-
45
-
46
-
47
-
48
-
49
-
50
-
51
-
52
-
53
-
54
-
55
-
56
-
57
-
58
-
59
-
60
-
61
-
62
-
63
-
64
-
65
-
66
-
 67
67 -
 68
68 -
 69
69 -
 70
70 -
 71
71 -
 72
72 -
 73
73 -
 74
74 -
 75
75 -
 76
76 -
 77
77 -
 78
78 -
 79
79 -
 80
80 -
 81
81 -
 82
82 -
 83
83 -
 84
84 -
 85
85 -
 86
86 -
 87
87 -
88
-
89
-
90
-
91
-
92
-
93
-
94
-
95
-
96
-
97
-
98
-
99
-
100
-
101
-
102
-
103
-
104
-
105
-
106
-
107
-
108
-
109
-
110
-
111
-
112
 |
 |

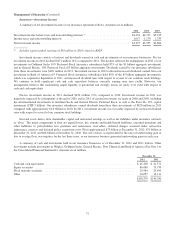
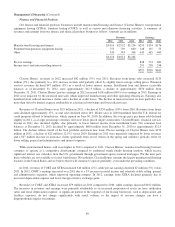
Management’s Discussion (Continued)
Utilities and Energy (“MidAmerican”) (Continued)
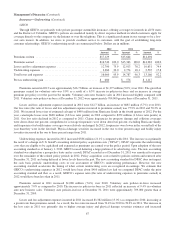
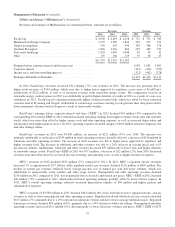
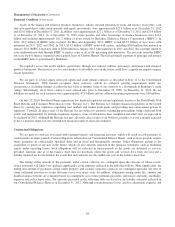
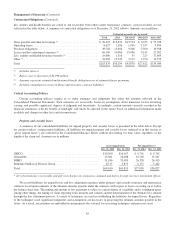
Revenues and earnings of MidAmerican are summarized below. Amounts are in millions.
Revenues Earnings
2012 2011 2010 2012 2011 2010
PacifiCorp .............................................. $ 4,950 $ 4,639 $ 4,518 $ 737 $ 771 $ 783
MidAmerican Energy Company ............................. 3,275 3,530 3,824 236 279 279
Natural gas pipelines ...................................... 978 993 994 383 388 378
Northern Powergrid ....................................... 1,036 1,016 804 429 469 333
Real estate brokerage ..................................... 1,333 1,007 1,046 82 39 42
Other .................................................. 175 106 119 91 36 47
$11,747 $11,291 $11,305
Earnings before corporate interest and income taxes ............. 1,958 1,982 1,862
Corporate interest ........................................ (314) (336) (353)
Income taxes and noncontrolling interests ..................... (321) (442) (378)
Earnings attributable to Berkshire ............................ $1,323 $1,204 $1,131
In 2012, PacifiCorp’s revenues increased $311 million (7%) over revenues in 2011. The increase was primarily due to
higher retail revenues of $244 million, which were due to higher prices approved by regulators across most of PacifiCorp’s
jurisdictions of $222 million, as well as to increased revenues from renewable energy credits. The comparative increase in
renewable energy credit revenues in 2012 was attributable in part to higher deferrals of credits in 2011 as a result of a rate case
settlement. In 2012, PacifiCorp also experienced generally higher customer load in Utah, which was offset by lower industrial
customer load in Wyoming and Oregon, attributable to certain large customers electing to self-generate their own power and by
lower residential customer load in Oregon as a result of unfavorable weather.
PacifiCorp’s earnings before corporate interest and taxes (“EBIT”) in 2012 declined $34 million (4%) compared to the
corresponding 2011 period. EBIT in 2012 reflected increased operating earnings from higher revenues (from rates and customer
loads), which was more than offset by higher energy costs and other operating expenses, as well as increased depreciation and
amortization from higher plant in service. In 2012, operating expenses included charges of $165 million related to litigation, fire
and other damage claims.
PacifiCorp’s revenues in 2011 were $4,639 million, an increase of $121 million (3%) over 2010. The increase was
primarily attributable to an increase of $350 million in retail operating revenues, partially offset by a decrease of $196 million in
wholesale and other operating revenues. The increase in retail revenues was due to higher prices approved by regulators and
higher customer load. The decrease in wholesale and other revenues was due to a 24% decrease in average prices and a 6%
decrease in volumes. Additionally, wholesale and other revenues decreased $57 million due to lower sales and higher deferrals
of renewable energy credits. PacifiCorp’s EBIT in 2011 was $771 million, a decrease of $12 million (2%) from 2010. Increased
revenues were more than offset by an overall increase in energy and operating costs, as well as higher net interest expense.
MEC’s revenues in 2012 declined $255 million (7%) compared to 2011. In 2012, MEC’s regulated electric revenues
increased 2% to approximately $1.7 billion, while regulated natural gas revenues declined $110 million to $659 million. The
decline in natural gas revenues reflected lower average per-unit cost of natural gas sold and lower volumes, which was
attributable to unseasonably warm weather and other usage factors. Nonregulated and other operating revenues declined
$178 million in 2012 compared to 2011, due to generally lower electricity and natural gas prices. MEC’s EBIT in 2012 declined
$43 million (15%) compared to 2011, which reflected lower operating earnings, partially offset by lower interest expense. In
2012, MEC’s overall operating earnings reflected increased depreciation expense of $56 million and higher general and
administrative expenses.
MEC’s revenues of $3,530 million in 2011 declined $294 million (8%) from 2010 due to lower regulated electric and gas
revenues as well as lower nonregulated and other operating revenues. Regulated retail and wholesale electric revenues declined
$117 million (7%), primarily due to a 19% reduction in wholesale volume and due to lower average wholesale prices. Regulated
natural gas revenues declined $83 million (10%), primarily due to a 30% decline in wholesale volume. Nonregulated and other
operating revenues decreased $112 million (9%), due principally to lower electricity volumes and prices. MEC’s EBIT of $279
75