Berkshire Hathaway 2012 Annual Report Download - page 45
Download and view the complete annual report
Please find page 45 of the 2012 Berkshire Hathaway annual report below. You can navigate through the pages in the report by either clicking on the pages listed below, or by using the keyword search tool below to find specific information within the annual report.-
 1
1 -
2
-
3
-
4
-
5
-
6
-
7
-
8
-
9
-
10
-
11
-
12
-
13
-
14
-
15
-
16
-
17
-
18
-
19
-
20
-
21
-
22
-
23
-
24
-
25
-
26
-
27
-
28
-
29
-
30
-
31
-
32
-
33
-
34
-
 35
35 -
 36
36 -
 37
37 -
 38
38 -
 39
39 -
 40
40 -
 41
41 -
 42
42 -
 43
43 -
 44
44 -
 45
45 -
 46
46 -
 47
47 -
 48
48 -
 49
49 -
 50
50 -
 51
51 -
 52
52 -
 53
53 -
 54
54 -
 55
55 -
56
-
57
-
58
-
59
-
60
-
61
-
62
-
63
-
64
-
65
-
66
-
67
-
68
-
69
-
70
-
71
-
72
-
73
-
74
-
75
-
76
-
77
-
78
-
79
-
80
-
81
-
82
-
83
-
84
-
85
-
86
-
87
-
88
-
89
-
90
-
91
-
92
-
93
-
94
-
95
-
96
-
97
-
98
-
99
-
100
-
101
-
102
-
103
-
104
-
105
-
106
-
107
-
108
-
109
-
110
-
111
-
112
 |
 |

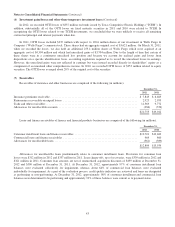
Notes to Consolidated Financial Statements (Continued)
(6) Investment gains/losses and other-than-temporary investment losses (Continued)
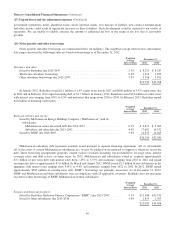
In 2012, we recorded OTTI losses of $337 million on bonds issued by Texas Competitive Electric Holdings (“TCEH”). In
addition, substantially all of the OTTI losses on fixed maturity securities in 2011 and 2010 were related to TCEH. In
recognizing the OTTI losses related to our TCEH investments, we concluded that we were unlikely to receive all remaining
contractual principal and interest payments when due.
In 2011, OTTI losses included $337 million with respect to 103.6 million shares of our investment in Wells Fargo &
Company (“Wells Fargo”) common stock. These shares had an aggregate original cost of $3,621 million. On March 31, 2011,
when we recorded the losses, we also held an additional 255.4 million shares of Wells Fargo which were acquired at an
aggregate cost of $4,394 million and which had unrealized gains of $3,704 million. Due to the length of time that certain of
these shares were in a continuous unrealized loss position and because we account for realized gains and losses from
dispositions on a specific identification basis, accounting regulations required us to record the unrealized losses in earnings.
However, the unrealized gains were not reflected in earnings but were instead recorded directly in shareholders’ equity as a
component of accumulated other comprehensive income. In 2010, we recorded OTTI losses of $953 million related to equity
securities. The OTTI losses averaged about 20% of the original cost of the securities.
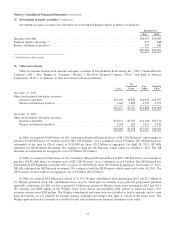
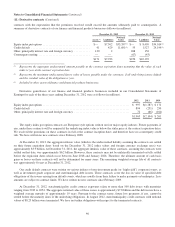
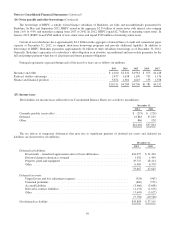
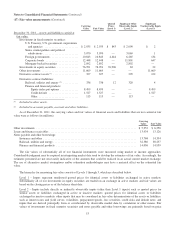
(7) Receivables
Receivables of insurance and other businesses are comprised of the following (in millions).
December 31,
2012 2011
Insurance premiums receivable ............................................................. $ 7,845 $ 6,663
Reinsurance recoverable on unpaid losses .................................................... 2,925 2,953
Trade and other receivables ................................................................ 11,369 9,772
Allowances for uncollectible accounts ....................................................... (386) (376)
$21,753 $19,012
Loans and finance receivables of finance and financial products businesses are comprised of the following (in millions).
December 31,
2012 2011
Consumer installment loans and finance receivables ............................................ $12,701 $13,463
Commercial loans and finance receivables .................................................... 469 860
Allowances for uncollectible loans .......................................................... (361) (389)
$12,809 $13,934
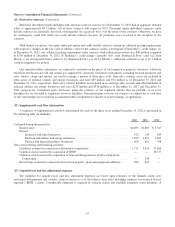
Allowances for uncollectible loans predominantly relate to consumer installment loans. Provisions for consumer loan
losses were $312 million in 2012 and $337 million in 2011. Loan charge-offs, net of recoveries, were $339 million in 2012 and
$321 million in 2011. Consumer loan amounts are net of unamortized acquisition discounts of $459 million at December 31,
2012 and $500 million at December 31, 2011. At December 31, 2012, approximately 97% of consumer installment loan
balances were evaluated collectively for impairment, whereas about 64% of commercial loan balances were evaluated
individually for impairment. As a part of the evaluation process, credit quality indicators are reviewed and loans are designated
as performing or non-performing. At December 31, 2012, approximately 98% of consumer installment and commercial loan
balances were determined to be performing and approximately 93% of those balances were current as to payment status.
43