Berkshire Hathaway 2012 Annual Report Download - page 67
Download and view the complete annual report
Please find page 67 of the 2012 Berkshire Hathaway annual report below. You can navigate through the pages in the report by either clicking on the pages listed below, or by using the keyword search tool below to find specific information within the annual report.-
 1
1 -
2
-
3
-
4
-
5
-
6
-
7
-
8
-
9
-
10
-
11
-
12
-
13
-
14
-
15
-
16
-
17
-
18
-
19
-
20
-
21
-
22
-
23
-
24
-
25
-
26
-
27
-
28
-
29
-
30
-
31
-
32
-
33
-
34
-
35
-
36
-
37
-
38
-
39
-
40
-
41
-
42
-
43
-
44
-
45
-
46
-
47
-
48
-
49
-
50
-
51
-
52
-
53
-
54
-
55
-
56
-
 57
57 -
 58
58 -
 59
59 -
 60
60 -
 61
61 -
 62
62 -
 63
63 -
 64
64 -
 65
65 -
 66
66 -
 67
67 -
 68
68 -
 69
69 -
 70
70 -
 71
71 -
 72
72 -
 73
73 -
 74
74 -
 75
75 -
 76
76 -
 77
77 -
78
-
79
-
80
-
81
-
82
-
83
-
84
-
85
-
86
-
87
-
88
-
89
-
90
-
91
-
92
-
93
-
94
-
95
-
96
-
97
-
98
-
99
-
100
-
101
-
102
-
103
-
104
-
105
-
106
-
107
-
108
-
109
-
110
-
111
-
112
 |
 |

BERKSHIRE HATHAWAY INC.
and Subsidiaries
Management’s Discussion and Analysis of
Financial Condition and Results of Operations
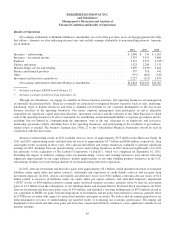
Results of Operations
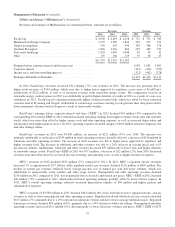
Net earnings attributable to Berkshire Hathaway shareholders for each of the past three years are disaggregated in the table
that follows. Amounts are after deducting income taxes and exclude earnings attributable to noncontrolling interests. Amounts
are in millions.
2012 2011 2010
Insurance – underwriting ......................................................... $ 1,046 $ 154 $ 1,301
Insurance – investment income .................................................... 3,397 3,555 3,860
Railroad ...................................................................... 3,372 2,972 2,235(1)
Utilities and energy ............................................................. 1,323 1,204 1,131
Manufacturing, service and retailing ................................................ 3,699 3,039(2) 2,462
Finance and financial products ..................................................... 557 516 441
Other ......................................................................... (797) (665) (337)
Investment and derivative gains/losses .............................................. 2,227 (521) 1,874
Net earnings attributable to Berkshire Hathaway shareholders ........................ $14,824 $10,254 $12,967
(1) Includes earnings of BNSF from February 12.
(2) Includes earnings of Lubrizol from September 16.
Through our subsidiaries, we engage in a number of diverse business activities. Our operating businesses are managed on
an unusually decentralized basis. There are essentially no centralized or integrated business functions (such as sales, marketing,
purchasing, legal or human resources) and there is minimal involvement by our corporate headquarters in the day-to-day
business activities of the operating businesses. Our senior corporate management team participates in and is ultimately
responsible for significant capital allocation decisions, investment activities and the selection of the Chief Executive to head
each of the operating businesses. It also is responsible for establishing and monitoring Berkshire’s corporate governance efforts,
including, but not limited to, communicating the appropriate “tone at the top” messages to its employees and associates,
monitoring governance efforts, including those at the operating businesses, and participating in the resolution of governance-
related issues as needed. The business segment data (Note 22 to the Consolidated Financial Statements) should be read in
conjunction with this discussion.
Insurance underwriting results in 2012 included after-tax losses of approximately $725 million from Hurricane Sandy. In
2011 and 2010, underwriting results included after-tax losses of approximately $1.7 billion and $600 million, respectively, from
catastrophe events occurring in those years. Our railroad and utilities and energy businesses continued to generate significant
earnings in 2012. Earnings from our manufacturing, service and retailing businesses in 2012 increased significantly over 2011
due primarily to the acquisition of The Lubrizol Corporation (“Lubrizol”), which was completed on September 16, 2011.
Excluding the impact of Lubrizol, earnings from our manufacturing, service and retailing businesses were mixed, reflecting
significant improvements in our carpet business, modest improvements in our other building products businesses in the U.S.,
and earnings declines in several foreign markets of our manufacturing and service operations.
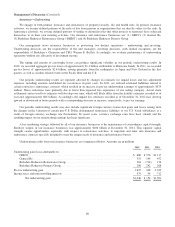
In 2012, after-tax investment and derivative gains were approximately $2.2 billion, which included reductions in estimated
liabilities under equity index put option contracts, settlements and expirations of credit default contracts and net gains from
investment disposals. In 2011, after-tax investment and derivative losses were $521 million, reflecting after-tax losses of $1.2
billion related to increases in liabilities under our equity index put option contracts and other-than-temporary impairment
(“OTTI”) losses of $590 million related to certain equity and fixed maturity securities, partially offset by after-tax investment
gains of $1.2 billion from the redemptions of our Goldman Sachs and General Electric Preferred Stock investments. In 2010,
after-tax investment and derivative gains were $1,874 million, and included a one-time holding gain of $979 million related to
our acquisition of BNSF, net gains from the dispositions of investments and net gains from derivative contracts, partially offset
by OTTI losses recorded with respect to certain fixed maturity and equity securities. We believe that investment gains/losses are
often meaningless in terms of understanding our reported results or evaluating our economic performance. The timing and
magnitude of investment and derivative gains and losses has caused and will likely continue to cause significant volatility in our
periodic earnings.
65