Berkshire Hathaway 2011 Annual Report Download - page 87
Download and view the complete annual report
Please find page 87 of the 2011 Berkshire Hathaway annual report below. You can navigate through the pages in the report by either clicking on the pages listed below, or by using the keyword search tool below to find specific information within the annual report.-
 1
1 -
2
-
3
-
4
-
5
-
6
-
7
-
8
-
9
-
10
-
11
-
12
-
13
-
14
-
15
-
16
-
17
-
18
-
19
-
20
-
21
-
22
-
23
-
24
-
25
-
26
-
27
-
28
-
29
-
30
-
31
-
32
-
33
-
34
-
35
-
36
-
37
-
38
-
39
-
40
-
41
-
42
-
43
-
44
-
45
-
46
-
47
-
48
-
49
-
50
-
51
-
52
-
53
-
54
-
55
-
56
-
57
-
58
-
59
-
60
-
61
-
62
-
63
-
64
-
65
-
66
-
67
-
68
-
69
-
70
-
71
-
72
-
73
-
74
-
75
-
76
-
 77
77 -
 78
78 -
 79
79 -
 80
80 -
 81
81 -
 82
82 -
 83
83 -
 84
84 -
 85
85 -
 86
86 -
 87
87 -
 88
88 -
 89
89 -
 90
90 -
 91
91 -
 92
92 -
 93
93 -
 94
94 -
 95
95 -
 96
96 -
 97
97 -
98
-
99
-
100
-
101
-
102
-
103
-
104
-
105
 |
 |
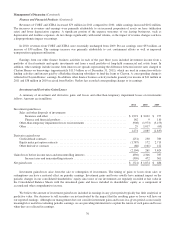
Management’s Discussion (Continued)
Property and casualty losses (Continued)
General Re (Continued)
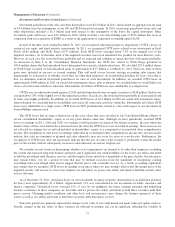
company claim reviews, changes in policy terms and coverage (such as client loss retention levels and occurrence and aggregate
policy limits), changes in loss trends and changes in legal trends that result in unanticipated losses, as well as other sources of
statistical variability. Collectively, these factors influence the selection of the expected loss emergence patterns.
We select expected loss ratios by reserve cell, by accident year, based upon reviewing forecasted losses and indicated
ultimate loss ratios that are predicted from aggregated pricing statistics. Indicated ultimate loss ratios are calculated using the
selected loss emergence pattern, reported losses and earned premium. If the selected emergence pattern is not accurate, then the
indicated ultimate loss ratios may not be accurate, which can affect the selected loss ratios and hence the IBNR reserve. As with
selected loss emergence patterns, selecting expected loss ratios is not a strictly mechanical process and judgment is used in the
analysis of indicated ultimate loss ratios and department pricing loss ratios.
We estimate IBNR reserves by reserve cell, by accident year, using the expected loss emergence patterns and the expected
loss ratios. The expected loss emergence patterns and expected loss ratios are the critical IBNR reserving assumptions and are
updated annually. Once the annual IBNR reserves are determined, our actuaries calculate expected case loss emergence for the
upcoming calendar year. These calculations do not involve new assumptions and use the prior year-end expected loss
emergence patterns and expected loss ratios. The expected losses are then allocated into interim estimates that are compared to
actual reported losses in the subsequent year. This comparison provides a test of the adequacy of prior year-end IBNR reserves
and forms the basis for possibly changing IBNR reserve assumptions during the course of the year.
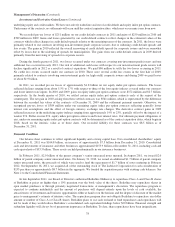
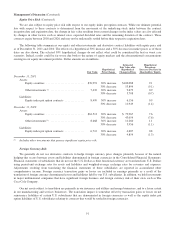
In 2011, our reported claims for prior years’ workers’ compensation losses were less than expected by $148 million.
However, further analysis of the workers’ compensation reserve cells by segment indicated the need for maintaining IBNR.
These developments precipitated a net increase of $94 million in nominal IBNR reserve estimates for unreported occurrences.
After adjusting for the $121 million net increase in liabilities from changes in net reserve discounts during the year, the net
increase in workers’ compensation losses from prior years’ occurrences reduced pre-tax earnings in 2011 by $67 million. To
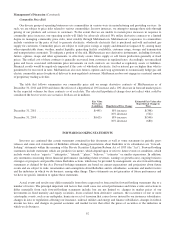
illustrate the sensitivity of changes in expected loss emergence patterns and expected loss ratios for our significant
excess-of-loss workers’ compensation reserve cells, an increase of ten points in the tail of the expected emergence pattern and
an increase of ten percent in the expected loss ratios would produce a net increase in our nominal IBNR reserves of
approximately $735 million and $382 million on a discounted basis as of December 31, 2011. The increase in discounted
reserves would produce a corresponding decrease in pre-tax earnings. We believe it is reasonably possible for the tail of the
expected loss emergence patterns and expected loss ratios to increase at these rates.
Our other casualty and general liability reported losses (excluding mass tort losses) developed downwards in 2011 relative
to expectations. Casualty losses tend to be long-tail and it should not be assumed that favorable loss experience in a given year
means that loss reserve amounts currently established will continue to develop favorably. For our significant other casualty and
general liability reserve cells (including medical malpractice, umbrella, auto and general liability), an increase of five points in
the tails of the expected emergence patterns and an increase of five percent in expected loss ratios (one percent for large
international proportional reserve cells) would produce a net increase in our nominal IBNR reserves and a corresponding
reduction in pre-tax earnings of approximately $912 million. We believe it is reasonably possible for the tail of the expected loss
emergence patterns and expected loss ratios to increase at these rates in any of the individual aforementioned reserve cells.
However, given the diversification in worldwide business, more likely outcomes are believed to be less than $912 million.
Overall, our property losses were greater than expected in 2011 as a result of catastrophe losses during the year. As a result,
our unpaid losses for property lines increased in 2011 by approximately $400 million from December 31, 2010. However, the
nature of property loss experience tends to be more volatile because of the effect of catastrophes and large individual property
losses. In addition, in response to favorable claim development information received during the year, estimated remaining
World Trade Center losses were reduced by $62 million.
In certain reserve cells within excess directors and officers and errors and omissions (“D&O and E&O”) coverages, IBNR
reserves are based on estimated ultimate losses without consideration of expected emergence patterns. These cells often involve
a spike in loss activity arising from recent industry developments making it difficult to select an expected loss emergence
pattern. For our large D&O and E&O reserve cells, an increase of ten points in the tail of the expected emergence pattern (for
those cells where emergence patterns are considered) and an increase of ten percent in the expected loss ratios would produce a
85