Berkshire Hathaway 2011 Annual Report Download - page 14
Download and view the complete annual report
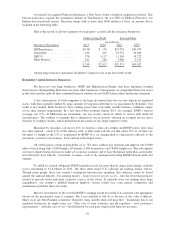
Please find page 14 of the 2011 Berkshire Hathaway annual report below. You can navigate through the pages in the report by either clicking on the pages listed below, or by using the keyword search tool below to find specific information within the annual report.-
 1
1 -
2
-
3
-
 4
4 -
 5
5 -
 6
6 -
 7
7 -
 8
8 -
 9
9 -
 10
10 -
 11
11 -
 12
12 -
 13
13 -
 14
14 -
 15
15 -
 16
16 -
 17
17 -
 18
18 -
 19
19 -
 20
20 -
 21
21 -
 22
22 -
 23
23 -
 24
24 -
25
-
26
-
27
-
28
-
29
-
30
-
31
-
32
-
33
-
34
-
35
-
36
-
37
-
38
-
39
-
40
-
41
-
42
-
43
-
44
-
45
-
46
-
47
-
48
-
49
-
50
-
51
-
52
-
53
-
54
-
55
-
56
-
57
-
58
-
59
-
60
-
61
-
62
-
63
-
64
-
65
-
66
-
67
-
68
-
69
-
70
-
71
-
72
-
73
-
74
-
75
-
76
-
77
-
78
-
79
-
80
-
81
-
82
-
83
-
84
-
85
-
86
-
87
-
88
-
89
-
90
-
91
-
92
-
93
-
94
-
95
-
96
-
97
-
98
-
99
-
100
-
101
-
102
-
103
-
104
-
105
 |
 |

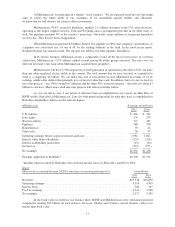
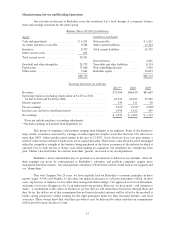
Manufacturing, Service and Retailing Operations
Our activities in this part of Berkshire cover the waterfront. Let’s look, though, at a summary balance
sheet and earnings statement for the entire group.
Balance Sheet 12/31/11 (in millions)
Assets Liabilities and Equity
Cash and equivalents ................... $ 4,241 Notes payable .................... $ 1,611
Accounts and notes receivable ........... 6,584 Other current liabilities ............. 15,124
Inventory ............................ 8,975 Total current liabilities ............. 16,735
Other current assets .................... 631
Total current assets .................... 20,431
Deferred taxes .................... 4,661
Goodwill and other intangibles ........... 24,755 Term debt and other liabilities ....... 6,214
Fixed assets .......................... 17,866 Non-controlling interests ............ 2,410
Other assets .......................... 3,661 Berkshire equity .................. 36,693
$66,713 $66,713
Earnings Statement (in millions)
2011** 2010 2009
Revenues ................................................... $72,406 $66,610 $61,665
Operating expenses (including depreciation of $1,431 in 2011,
$1,362 in 2010 and $1,422 in 2009) ............................ 67,239 62,225 59,509
Interest expense .............................................. 130 111 98
Pre-tax earnings .............................................. 5,037* 4,274* 2,058*
Income taxes and non-controlling interests ........................ 1,998 1,812 945
Net earnings ................................................ $ 3,039 $ 2,462 $ 1,113
*Does not include purchase-accounting adjustments.
**Includes earnings of Lubrizol from September 16.
This group of companies sells products ranging from lollipops to jet airplanes. Some of the businesses
enjoy terrific economics, measured by earnings on unleveraged net tangible assets that run from 25% after-tax to
more than 100%. Others produce good returns in the area of 12-20%. A few, however, have very poor returns, a
result of some serious mistakes I made in my job of capital allocation. These errors came about because I misjudged
either the competitive strength of the business being purchased or the future economics of the industry in which it
operated. I try to look out ten or twenty years when making an acquisition, but sometimes my eyesight has been
poor. Charlie’s has been better; he voted no more than “present” on several of my errant purchases.
Berkshire’s newer shareholders may be puzzled over our decision to hold on to my mistakes. After all,
their earnings can never be consequential to Berkshire’s valuation, and problem companies require more
managerial time than winners. Any management consultant or Wall Street advisor would look at our laggards and
say “dump them.”
That won’t happen. For 29 years, we have regularly laid out Berkshire’s economic principles in these
reports (pages 93-98) and Number 11 describes our general reluctance to sell poor performers (which, in most
cases, lag because of industry factors rather than managerial shortcomings). Our approach is far from Darwinian,
and many of you may disapprove of it. I can understand your position. However, we have made – and continue to
make – a commitment to the sellers of businesses we buy that we will retain those businesses through thick and
thin. So far, the dollar cost of that commitment has not been substantial and may well be offset by the goodwill it
builds among prospective sellers looking for the right permanent home for their treasured business and loyal
associates. These owners know that what they get with us can’t be delivered by others and that our commitments
will be good for many decades to come.
12