Berkshire Hathaway 2011 Annual Report Download - page 74
Download and view the complete annual report
Please find page 74 of the 2011 Berkshire Hathaway annual report below. You can navigate through the pages in the report by either clicking on the pages listed below, or by using the keyword search tool below to find specific information within the annual report.-
 1
1 -
2
-
3
-
4
-
5
-
6
-
7
-
8
-
9
-
10
-
11
-
12
-
13
-
14
-
15
-
16
-
17
-
18
-
19
-
20
-
21
-
22
-
23
-
24
-
25
-
26
-
27
-
28
-
29
-
30
-
31
-
32
-
33
-
34
-
35
-
36
-
37
-
38
-
39
-
40
-
41
-
42
-
43
-
44
-
45
-
46
-
47
-
48
-
49
-
50
-
51
-
52
-
53
-
54
-
55
-
56
-
57
-
58
-
59
-
60
-
61
-
62
-
63
-
 64
64 -
 65
65 -
 66
66 -
 67
67 -
 68
68 -
 69
69 -
 70
70 -
 71
71 -
 72
72 -
 73
73 -
 74
74 -
 75
75 -
 76
76 -
 77
77 -
 78
78 -
 79
79 -
 80
80 -
 81
81 -
 82
82 -
 83
83 -
 84
84 -
85
-
86
-
87
-
88
-
89
-
90
-
91
-
92
-
93
-
94
-
95
-
96
-
97
-
98
-
99
-
100
-
101
-
102
-
103
-
104
-
105
 |
 |

Management’s Discussion (Continued)
Utilities and Energy (“MidAmerican”) (Continued)
Revenues of MEC in 2010 increased $113 million (3%) over 2009, primarily due to higher volumes of regulated and
non-regulated electricity sales which are attributable to higher customer usage, impacted by weather conditions and customer
growth. EBIT was $279 million in 2010, a slight decrease compared to 2009, primarily due to higher energy costs and operating
expenses. Energy costs increased due to higher coal prices and greater thermal generation as a result of higher sales volume.
Operating expenses increased due to higher maintenance costs from plant outages and storm damages.
Natural gas pipelines revenues and EBIT in 2011 were relatively unchanged from 2010. Natural gas pipelines revenues and
EBIT each declined $79 million in 2010 from 2009, which was primarily due to lower transportation volume resulting from less
favorable economic conditions and lower natural gas price spreads.
Revenues of Northern Powergrid were $1,016 million in 2011, an increase of $212 million (26%) from 2010. The increase
was primarily due to an increase of $197 million in distribution revenue, and to a lesser degree to a weaker U.S. Dollar. EBIT in
2011 was $469 million, an increase of $136 million (41%) over 2010. The increase was also primarily due to higher distribution
revenues and the weaker U.S. Dollar. In addition, EBIT in 2010 included a $45 million gain on the sale of a subsidiary.
Revenues decreased $25 million in 2010 from 2009 due to lower contracting revenue and lower gas production, partially offset
by higher distribution revenue. The increase in EBIT of $85 million in 2010 as compared to 2009 was due to the aforementioned
subsidiary sale during 2010 and an impairment charged recorded during 2009.
Revenues of the real estate brokerage business were $1,007 million in 2011, down 4% from $1,046 million in 2010,
primarily due to a 4% decrease in average home sale prices. EBIT of the real estate brokerage business of $39 million was 7%
lower than the $42 million in 2010 which was relatively unchanged as compared to 2009.
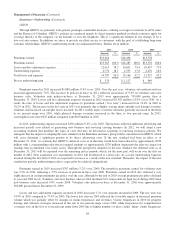
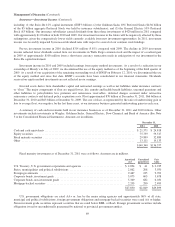
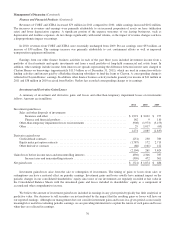
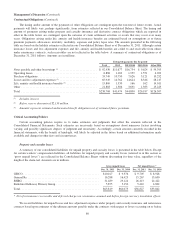
Manufacturing, Service and Retailing
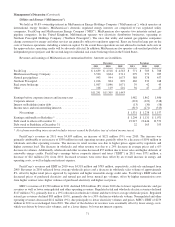
A summary of revenues and earnings of our manufacturing, service and retailing businesses follows. Amounts are
in millions.
Revenues Earnings
2011 2010 2009 2011 2010 2009
Marmon ................................................ $ 6,925 $ 5,967 $ 5,067 $ 992 $ 813 $ 686
McLane Company ........................................ 33,279 32,687 31,207 370 369 344
Other manufacturing ...................................... 21,191 17,664 15,937 2,397 1,911 958
Other service ............................................ 7,934 7,355 6,585 1,039 984 (91)
Retailing ............................................... 3,077 2,937 2,869 239 197 161
$72,406 $66,610 $61,665
Pre-tax earnings .......................................... $5,037 $4,274 $2,058
Income taxes and noncontrolling interests ..................... 1,998 1,812 945
$3,039 $2,462 $1,113
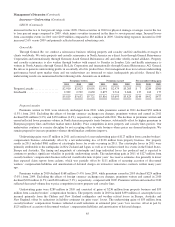
Marmon
Through Marmon, we operate approximately 140 manufacturing and service businesses that operate independently within
eleven diverse business sectors. Revenues in 2011 were $6.9 billion, an increase of approximately 16% over 2010. An estimated
25% of the aggregate revenue increase was attributed to increased copper prices affecting the Building Wire and Flow Products
sectors, where copper cost increases are passed on to customers with little or no additional margin. Ten of the eleven business
sectors produced comparative revenue increases. The only sector reporting a comparative revenue decrease was the Retail Store
Fixtures sector, where its largest customer significantly reduced its purchases.
Pre-tax earnings in 2011 were $992 million, an increase of approximately 22% over 2010. Pre-tax earnings as a percent of
revenues was 14.3% in 2011 as compared to 13.6% in 2010. Pre-tax earnings to revenues percentages were negatively impacted
by the increases in copper prices in both 2011 and 2010. Ten of the eleven sectors produced increased pre-tax earnings in 2011
compared to 2010. The Retail Store Fixtures sector reported lower pre-tax earnings consistent with the revenue decline. The
improvements in revenues and pre-tax earnings generally reflected continued recoveries in many of Marmon’s end markets,
increased product innovation and Marmon’s ongoing effort to control overhead costs.
72