Berkshire Hathaway 2001 Annual Report Download - page 13
Download and view the complete annual report
Please find page 13 of the 2001 Berkshire Hathaway annual report below. You can navigate through the pages in the report by either clicking on the pages listed below, or by using the keyword search tool below to find specific information within the annual report.-
 1
1 -
2
-
 3
3 -
 4
4 -
 5
5 -
 6
6 -
 7
7 -
 8
8 -
 9
9 -
 10
10 -
 11
11 -
 12
12 -
 13
13 -
 14
14 -
 15
15 -
 16
16 -
 17
17 -
 18
18 -
 19
19 -
 20
20 -
 21
21 -
 22
22 -
 23
23 -
24
-
25
-
26
-
27
-
28
-
29
-
30
-
31
-
32
-
33
-
34
-
35
-
36
-
37
-
38
-
39
-
40
-
41
-
42
-
43
-
44
-
45
-
46
-
47
-
48
-
49
-
50
-
51
-
52
-
53
-
54
-
55
-
56
-
57
-
58
-
59
-
60
-
61
-
62
-
63
-
64
-
65
-
66
-
67
-
68
-
69
-
70
-
71
-
72
-
73
-
74
 |
 |

12
Because of this one-sided experience, it is folly to suggest, as some are doing, that all property/casualty
insurance reserves be discounted, an approach reflecting the fact that they will be paid in the future and that
therefore their present value is less than the stated liability for them. Discounting might be acceptable if reserves
could be precisely established. They cant, however, because a myriad of forces judicial broadening of policy
language and medical inflation, to name just two chronic problems are constantly working to make reserves
inadequate. Discounting would exacerbate this already-serious situation and, additionally, would provide a new
tool for the companies that are inclined to fudge.
Id say that the effects from telling a profit-challenged insurance CEO to lower reserves through
discounting would be comparable to those that would ensue if a father told his 16-year-old son to have a normal sex
life. Neither party needs that kind of push.
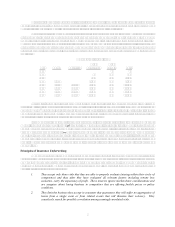
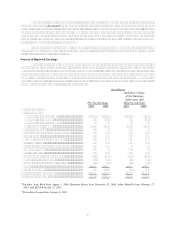
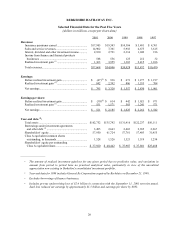
Sources of Reported Earnings
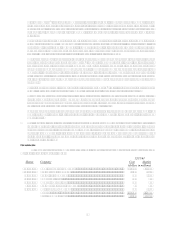
The table that follows shows the main sources of Berkshire's reported earnings. In this presentation,
purchase-accounting adjustments (primarily relating to goodwill) are not assigned to the specific businesses to
which they apply, but are instead aggregated and shown separately. This procedure lets you view the earnings of
our businesses as they would have been reported had we not purchased them. In recent years, our expense for
goodwill amortization has been large. Going forward, generally accepted accounting principles (GAAP) will no
longer require amortization of goodwill. This change will increase our reported earnings (though not our true
economic earnings) and simplify this section of the report.
(in millions)
Berkshire’s Share
of Net Earnings
(after taxes and
Pre-Tax Earnings Minority interests)
2001 2000 2001 2000
Operating Earnings:
Insurance Group:
Underwriting Reinsurance................................... $(4,318) $(1,416) $(2,824) $(911)
Underwriting GEICO .......................................... 221 (224) 144 (146)
Underwriting Other Primary ............................... 30 25 18 16
Net Investment Income .......................................... 2,824 2,773 1,968 1,946
Building Products(1)................................................... 461 34 287 21
Finance and Financial Products Business ................. 519 530 336 343
Flight Services........................................................... 186 213 105 126
MidAmerican Energy (76% owned) ......................... 600 197 230 109
Retail Operations....................................................... 175 175 101 104
Scott Fetzer (excluding finance operation) ............... 129 122 83 80
Shaw Industries(2) ...................................................... 292 -- 156 --
Other Businesses ....................................................... 179 221 103 133
Purchase-Accounting Adjustments ........................... (726) (881) (699) (843)
Corporate Interest Expense ....................................... (92) (92) (60) (61)
Shareholder-Designated Contributions ..................... (17) (17) (11) (11)
Other ......................................................................... 25 39 16 30
Operating Earnings ...................................................... 488 1,699 (47) 936
Capital Gains from Investments................................... 1,320 3,955 842 2,392
Total Earnings All Entities........................................ $1,808 $5,654 $ 795 $3,328
(1) Includes Acme Brick from August 1, 2000; Benjamin Moore from December 18, 2000; Johns Manville from February 27,
2001; and MiTek from July 31, 2001.
(2) From date of acquisition, January 8, 2001.