Berkshire Hathaway 2000 Annual Report Download - page 44
Download and view the complete annual report
Please find page 44 of the 2000 Berkshire Hathaway annual report below. You can navigate through the pages in the report by either clicking on the pages listed below, or by using the keyword search tool below to find specific information within the annual report.-
 1
1 -
2
-
3
-
4
-
5
-
6
-
7
-
8
-
9
-
10
-
11
-
12
-
13
-
14
-
15
-
16
-
17
-
18
-
19
-
20
-
21
-
22
-
23
-
24
-
25
-
26
-
27
-
28
-
29
-
30
-
31
-
32
-
33
-
 34
34 -
 35
35 -
 36
36 -
 37
37 -
 38
38 -
 39
39 -
 40
40 -
 41
41 -
 42
42 -
 43
43 -
 44
44 -
 45
45 -
 46
46 -
 47
47 -
 48
48 -
 49
49 -
 50
50 -
 51
51 -
 52
52 -
 53
53 -
 54
54 -
55
-
56
-
57
-
58
-
59
-
60
-
61
-
62
-
63
-
64
-
65
-
66
-
67
-
68
-
69
-
70
-
71
-
72
-
73
-
74
-
75
-
76
-
77
-
78
 |
 |

43
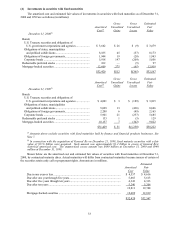
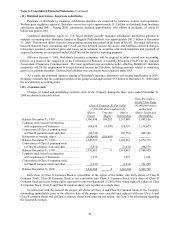
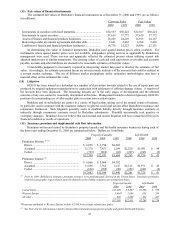
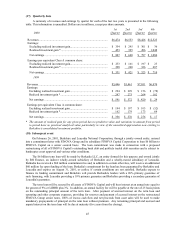
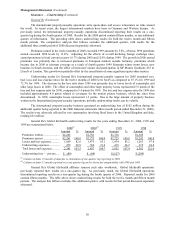
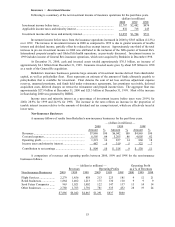
(16) Business Segment Data (Continued)
A disaggregation of Berkshire’s consolidated data for each of the three most recent years is presented in the tables
which follow on this and the following page. Amounts are in millions.
Revenues
2000 1999 1998
Operating Segments:
Insurance group:
Premiums earned:
GEICO................................................................................................ $ 5,610 $ 4,757 $ 4,033
General Re **...................................................................................... 8,696 6,905 —
Berkshire Hathaway Reinsurance Group .............................................. 4,705 2,382 939
Berkshire Hathaway Direct Insurance Group........................................ 332 262 328
Interest, dividend and other investment income....................................... 2,810 2,500 982
Total insurance group................................................................................ 22,153 16,806 6,282
Flight services........................................................................................... 2,279 1,856 858
Retail businesses ....................................................................................... 1,864 1,402 1,213
Scott Fetzer Companies............................................................................. 963 1,021 1,002
Other businesses ....................................................................................... 2,780 1,763 1,792
30,039 22,848 11,147
Reconciliation of segments to consolidated amount:
Realized investment gain........................................................................ 3,955 1,365 2,415
Other revenues ....................................................................................... 118 40 276
Purchase-accounting adjustments............................................................ (136) (225) (6)
$33,976 $24,028 $13,832
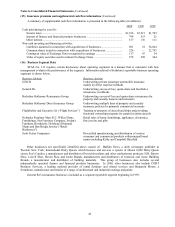
Operating Profit before Taxes
2000 1999 1998
Operating Segments:
Insurance group operating profit:
Underwriting profit(loss):
GEICO................................................................................................ $ (224) $ 24 $ 269
General Re **...................................................................................... (1,224) (1,184) —
Berkshire Hathaway Reinsurance Group .............................................. (175) (256) (21)
Berkshire Hathaway Direct Insurance Group........................................ 38 22 17
Interest, dividend and other investment income....................................... 2,787 2,482 974
Total insurance group operating profit ....................................................... 1,202 1,088 1,239
Flight services........................................................................................... 213 225 181
Retail businesses ....................................................................................... 175 130 110
Scott Fetzer Companies............................................................................. 122 147 137
Other businesses ....................................................................................... 781 335 432
2,493 1,925 2,099
Reconciliation of segments to consolidated amount:
Realized investment gain........................................................................ 3,955 1,365 2,415
Interest expense *................................................................................... (92) (109) (100)
Corporate and other................................................................................ 87 8 23
Goodwill amortization and other purchase-accounting adjustments ......... (856) (739) (123)
$ 5,587 $ 2,450 $ 4,314
*Amounts of interest expense represent interest on borrowings under investment agreements and other debt
exclusive of that of finance businesses and interest allocated to certain businesses.
** See Note 1(a) for additional information concerning the reporting of General Re’s international property/casualty
and global life/health businesses.