Berkshire Hathaway 2000 Annual Report Download - page 37
Download and view the complete annual report
Please find page 37 of the 2000 Berkshire Hathaway annual report below. You can navigate through the pages in the report by either clicking on the pages listed below, or by using the keyword search tool below to find specific information within the annual report.-
 1
1 -
2
-
3
-
4
-
5
-
6
-
7
-
8
-
9
-
10
-
11
-
12
-
13
-
14
-
15
-
16
-
17
-
18
-
19
-
20
-
21
-
22
-
23
-
24
-
25
-
26
-
 27
27 -
 28
28 -
 29
29 -
 30
30 -
 31
31 -
 32
32 -
 33
33 -
 34
34 -
 35
35 -
 36
36 -
 37
37 -
 38
38 -
 39
39 -
 40
40 -
 41
41 -
 42
42 -
 43
43 -
 44
44 -
 45
45 -
 46
46 -
 47
47 -
48
-
49
-
50
-
51
-
52
-
53
-
54
-
55
-
56
-
57
-
58
-
59
-
60
-
61
-
62
-
63
-
64
-
65
-
66
-
67
-
68
-
69
-
70
-
71
-
72
-
73
-
74
-
75
-
76
-
77
-
78
 |
 |

36
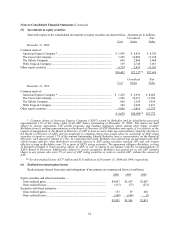
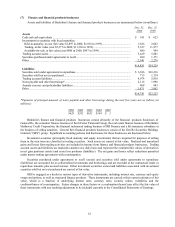
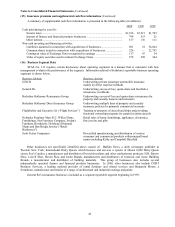
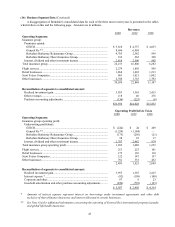
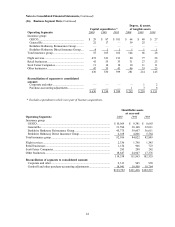
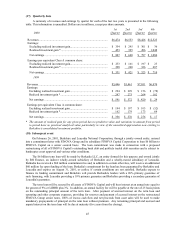
Notes to Consolidated Financial Statements (Continued)
(7) Finance and financial products businesses (Continued)
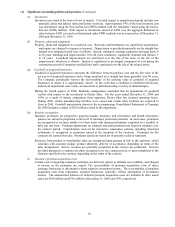
Interest rate, currency and equity swaps are agreements between two parties to exchange, at particular intervals,
payment streams calculated on a specified notional amount. Interest rate, currency and equity options grant the
purchaser the right, but not the obligation, to either purchase from or sell to the writer a specified financial instrument
under agreed terms. Interest rate caps and floors require the writer to pay the purchaser at specified future dates the
amount, if any, by which the option’s underlying market interest rate exceeds the fixed cap or falls below the fixed floor,
applied to a notional amount.
Futures contracts are commitments to either purchase or sell a financial instrument at a future date for a specified
price and are generally settled in cash. Forward-rate agreements are financial instruments that settle in cash at a
specified future date based on the differential between agreed interest rates applied to a notional amount. Foreign
exchange contracts generally involve the exchange of two currencies at agreed rates on a specified date; spot contracts
usually require the exchange to occur within two business days of the contract date.
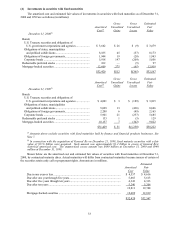
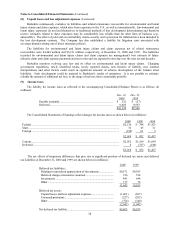
A summary of notional amounts of derivative contracts at December 31, 2000 and 1999 is included in the table
below. For these transactions, the notional amount represents the principal volume, which is referenced by the
counterparties in computing payments to be exchanged, and are not indicative of the Company’s exposure to market or
credit risk, future cash requirements or receipts from such transactions.
December 31, 2000 December 31, 1999
(in millions) (in millions)
Interest rate and currency swap agreements ................................... $651,913 $531,645
Options written ............................................................................ 91,655 121,683
Options purchased........................................................................ 102,743 151,006
Financial futures contracts:
Commitments to purchase.......................................................... 9,535 32,377
Commitments to sell.................................................................. 17,069 11,368
Forward - rate agreements ............................................................ 7,070 5,164
Foreign exchange spot and forward contracts ................................ 6,163 10,430
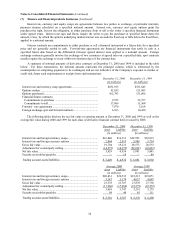
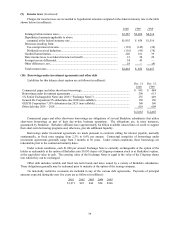
The following tables disclose the net fair value or carrying amount at December 31, 2000 and 1999 as well as the
average fair value during 2000 and 1999 for each class of derivative financial contract held or issued by GRS.
December 31, 2000 December 31, 1999
Asset Liability Asset Liability
(in millions) (in millions)
Interest rate and foreign currency swaps........................................ $16,840 $16,312 $22,593 $22,819
Interest rate and foreign currency options...................................... 2,864 2,919 5,980 5,714
Gross fair value............................................................................ 19,704 19,231 28,573 28,533
Adjustment for counterparty netting.............................................. (14,275)(14,275)(22,692)(22,692)
Net fair value ............................................................................... 5,429 4,956 5,881 5,841
Security receivables/payables ....................................................... — 18 — 89
Trading account assets/liabilities................................................... $ 5,429 $ 4,974 $ 5,881 $ 5,930
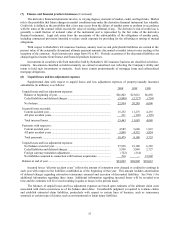
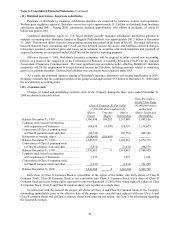
Average 2000 Average 1999
Asset Liability Asset Liability
(in millions) (in millions)
Interest rate and foreign currency swaps........................................ $20,431 $20,533 $23,213 $23,071
Interest rate and foreign currency options...................................... 3,147 3,174 4,657 4,687
Gross fair value............................................................................ 23,578 23,707 27,870 27,758
Adjustment for counterparty netting.............................................. (17,960)(17,960)(22,579)(22,579)
Net fair value ............................................................................... 5,618 5,747 5,291 5,179
Security receivables/payables ....................................................... 98 40 85 111
Trading account assets/liabilities................................................... $ 5,716 $ 5,787 $ 5,376 $ 5,290