Berkshire Hathaway 2000 Annual Report Download - page 42
Download and view the complete annual report
Please find page 42 of the 2000 Berkshire Hathaway annual report below. You can navigate through the pages in the report by either clicking on the pages listed below, or by using the keyword search tool below to find specific information within the annual report.-
 1
1 -
2
-
3
-
4
-
5
-
6
-
7
-
8
-
9
-
10
-
11
-
12
-
13
-
14
-
15
-
16
-
17
-
18
-
19
-
20
-
21
-
22
-
23
-
24
-
25
-
26
-
27
-
28
-
29
-
30
-
31
-
 32
32 -
 33
33 -
 34
34 -
 35
35 -
 36
36 -
 37
37 -
 38
38 -
 39
39 -
 40
40 -
 41
41 -
 42
42 -
 43
43 -
 44
44 -
 45
45 -
 46
46 -
 47
47 -
 48
48 -
 49
49 -
 50
50 -
 51
51 -
 52
52 -
53
-
54
-
55
-
56
-
57
-
58
-
59
-
60
-
61
-
62
-
63
-
64
-
65
-
66
-
67
-
68
-
69
-
70
-
71
-
72
-
73
-
74
-
75
-
76
-
77
-
78
 |
 |

41
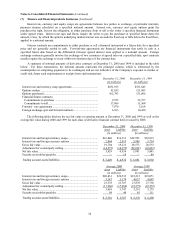
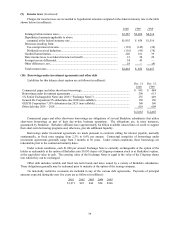
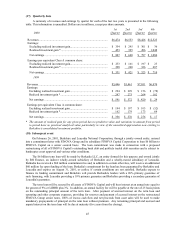
(13) Fair values of financial instruments
The estimated fair values of Berkshire’s financial instruments as of December 31, 2000 and 1999, are as follows
(in millions): Carrying Value Fair Value
2000 1999 2000 1999
Investments in securities with fixed maturities.................................. $32,567 $30,222 $32,567 $30,222
Investments in equity securities........................................................ 37,619 37,772 37,619 37,772
Assets of finance and financial products businesses .......................... 16,829 24,229 16,913 24,167
Borrowings under investment agreements and other debt .................. 2,663 2,465 2,704 2,418
Liabilities of finance and financial products businesses..................... 14,730 22,223 14,896 22,151
In determining fair value of financial instruments, Berkshire used quoted market prices when available. For
instruments where quoted market prices were not available, independent pricing services or appraisals by Berkshire’s
management were used. Those services and appraisals reflected the estimated present values utilizing current risk
adjusted market rates of similar instruments. The carrying values of cash and cash equivalents, receivables and accounts
payable, accruals and other liabilities are deemed to be reasonable estimates of their fair values.
Considerable judgment is necessarily required in interpreting market data used to develop the estimates of fair
value. Accordingly, the estimates presented herein are not necessarily indicative of the amounts that could be realized in
a current market exchange. The use of different market assumptions and/or estimation methodologies may have a
material effect on the estimated fair value.
(14) Litigation
GEICO has been named as a defendant in a number of class action lawsuits related to the use of repair parts not
produced by original equipment manufacturers in connection with settlement of collision damage claims. A number of
the lawsuits have been dismissed. The remaining lawsuits are in the early stages of development and the ultimate
outcome of any case cannot be reasonably determined at this time. Management intends to defend vigorously GEICO’s
position of recommending use of after-market parts in certain auto accident repairs.
Berkshire and its subsidiaries are parties in a variety of legal actions arising out of the normal course of business.
In particular, and in common with the insurance industry in general, such legal actions affect Berkshire’s insurance and
reinsurance businesses. Such litigation generally seeks to establish liability directly through insurance contracts or
indirectly through reinsurance contracts issued by Berkshire subsidiaries. Plaintiffs occasionally seek punitive or
exemplary damages. Berkshire does not believe that such normal and routine litigation will have a material effect on its
financial condition or results of operations.
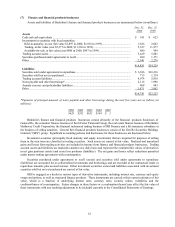
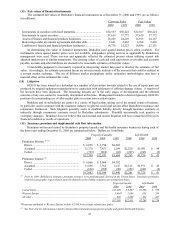
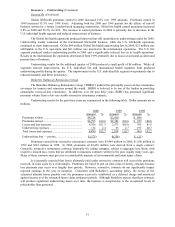
(15) Insurance premium and supplemental cash flow information
Premiums written and earned by Berkshire’s property/casualty and life/health insurance businesses during each of
the three years ending December 31, 2000 are summarized below. Dollars are in millions.
Property/Casualty Life/Health
2000 1999 1998 2000 1999 1998
Premiums Written:
(1) (2)
Direct............................................................... $ 6,858 $ 5,798 $4,503
Assumed .......................................................... 11,270 7,951 1,184 $2,520 $1,981 $ 46
Ceded .............................................................. (729) (818) (83) (257) (245) (5)
$17,399 $12,931 $5,604 $2,263 $1,736 $ 41
Premiums Earned:
(2)
Direct............................................................... $ 6,666 $ 5,606 $4,382
Assumed .......................................................... 11,036 7,762 1,147 $2,513 $1,971 $ 45
Ceded .............................................................. (620) (788) (89) (252) (245) (4)
$17,082 $12,580 $5,440 $2,261 $1,726 $ 41
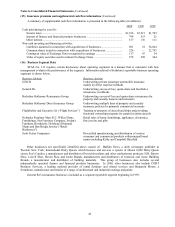
(1) Prior to 1999, Berkshire’s insurance premium revenues were predominantly derived in the United States. Insurance premiums
written by geographic region (based upon the domicile of the ceding company) are summarized below.
Property/Casualty
Life/Health
2000
1999
2000
1999
United States
.......................................................................................................
$11,409
$ 8,862
$1,296
$ 970
Western Europe
...................................................................................................
5,064*
2,000
633
539
All other
..............................................................................................................
926
2,069
334
227
$17,399
$12,931
$2,263
$1,736
*Premiums attributed to Western Europe include $2,438 from a single reinsurance policy.
(2) See Note 1(a) for information related to General Re’s international property/casualty and global life/health business.