Barnes and Noble 2012 Annual Report Download - page 7
Download and view the complete annual report
Please find page 7 of the 2012 Barnes and Noble annual report below. You can navigate through the pages in the report by either clicking on the pages listed below, or by using the keyword search tool below to find specific information within the annual report.-
 1
1 -
 2
2 -
 3
3 -
 4
4 -
 5
5 -
 6
6 -
 7
7 -
 8
8 -
 9
9 -
 10
10 -
 11
11 -
 12
12 -
 13
13 -
 14
14 -
 15
15 -
 16
16 -
 17
17 -
 18
18 -
19
-
20
-
21
-
22
-
23
-
24
-
25
-
26
-
27
-
28
-
29
-
30
-
31
-
32
-
33
-
34
-
35
-
36
-
37
-
38
-
39
-
40
-
41
-
42
-
43
-
44
-
45
-
46
-
47
-
48
-
49
-
50
-
51
-
52
-
53
-
54
-
55
-
56
-
57
-
58
-
59
-
60
-
61
-
62
-
63
-
64
-
65
-
66
-
67
-
68
-
69
-
70
-
71
-
72
 |
 |

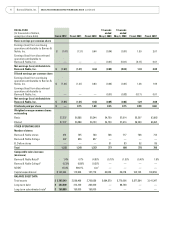
FISCAL YEAR
(In thousands of dollars,
except per share data) Fiscal 2012 Fiscal 2011 Fiscal 2010
13 weeks
ended
May 2, 2009
13 weeks
ended
May 3, 2008 Fiscal 2008 Fiscal 2007
STATEMENT OF OPERATIONS DATA
Sales
Barnes & Noble Retail $ 4,852,913 4,926,834 4,947,469 1,105,152 1,155,882 5,121,804 5,286,674
Barnes & Noble Collegea1,743,662 1,778,159 833,648 — — — —
NOOK 933,471 695,182 105,435 — — — —
Eliminationb (400,847) (401,610) (78,798) — — — —
Total sales 7,129,199 6,998,565 5,807,754 1,105,152 1,155,882 5,121,804 5,286,674
Cost of sales and occupancy 5,218,383 5,205,712 4,131,009 773,491 807,915 3,540,596 3,679,845
Gross profi t 1,910,816 1,792,853 1,676,745 331,661 347,967 1,581,208 1,606,829
Selling and administrative
expensesc1,739,452 1,629,465 1,395,725 289,026 308,400 1,264,320 1,236,178
Depreciation and amortization 232,667 228,647 207,774 45,879 41,314 173,557 168,600
Operating profi t (loss) (61,303) (65,259) 73,246 (3,244) (1,747) 143,331 202,051
Interest income (expense), net and
amortization of deferred fi nancing
feesd (35,304) (57,350) (28,237) (199) 807 (2,344) 7,483
Earnings (loss) from continuing
operations before taxes (96,607) (122,609) 45,009 (3,443) (940) 140,987 209,534
Income taxes (27,740) (48,652) 8,365 (1,374) (374) 55,591 74,623
Earnings (loss) from continuing
operations (net of income tax) (68,867) (73,957) 36,644 (2,069) (566) 85,396 134,911
Earnings (loss) from discontinued
operations (net of income tax)e— — — (654) (1,658) (9,506) 888
Net earnings (loss) (68,867) (73,957) 36,644 (2,723) (2,224) 75,890 135,799
Net loss attributable to
noncontrolling interestsf— 37 32 30 — 30 —
Net earnings (loss) attributable to
Barnes & Noble, Inc. $ (68,867) (73,920) 36,676 (2,693) (2,224) 75,920 135,799
Earnings (loss) attributable to
Barnes & Noble, Inc.
Earnings (loss) from continuing
operations $ (68,867) (73,957) 36,644 (2,069) (566) 85,396 134,911
Less loss attributable to
noncontrolling interests — 37 32 30 — 30 —
Net earnings (loss) from continuing
operations attributable to
Barnes & Noble, Inc. $ (68,867) (73,920) 36,676 (2,039) (566) 85,426 134,911
2012 Annual Report 5