Barnes and Noble 2012 Annual Report Download - page 17
Download and view the complete annual report
Please find page 17 of the 2012 Barnes and Noble annual report below. You can navigate through the pages in the report by either clicking on the pages listed below, or by using the keyword search tool below to find specific information within the annual report.-
 1
1 -
2
-
3
-
4
-
5
-
6
-
 7
7 -
 8
8 -
 9
9 -
 10
10 -
 11
11 -
 12
12 -
 13
13 -
 14
14 -
 15
15 -
 16
16 -
 17
17 -
 18
18 -
 19
19 -
 20
20 -
 21
21 -
 22
22 -
 23
23 -
 24
24 -
 25
25 -
 26
26 -
 27
27 -
28
-
29
-
30
-
31
-
32
-
33
-
34
-
35
-
36
-
37
-
38
-
39
-
40
-
41
-
42
-
43
-
44
-
45
-
46
-
47
-
48
-
49
-
50
-
51
-
52
-
53
-
54
-
55
-
56
-
57
-
58
-
59
-
60
-
61
-
62
-
63
-
64
-
65
-
66
-
67
-
68
-
69
-
70
-
71
-
72
 |
 |

• NOOK sales increased . million, or ., to
. million during fi scal from . million
during fi scal . Comparable sales for NOOK increased
. in fi scal . This increase in sales was primarily
due to higher sales of digital content and hardware.
• The elimination represents sales from NOOK to B&N
Retail and B&N College that were sold through to the end
user. These amounts remained fl at year over year despite
NOOK’s top line increase due to higher sales to third
party distribution channels.
In fi scal , the Company closed Barnes & Noble
stores, bringing its total number of Barnes & Noble stores
to with . million square feet. In fi scal , the
Company added B&N College stores and closed , end-
ing the period with B&N College stores. As of April ,
, the Company operated , stores in the fi fty states
and the District of Columbia.
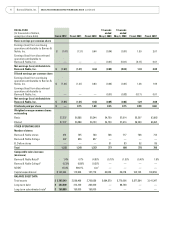
Cost of Sales and Occupancy
52 weeks ended
Dollars in thousands
April 28,
2012 % Sales
April 30,
2011 % Sales
B&N Retail $ 3,405,474 70.2% $ 3,499,825 71.1%
B&N College 1,348,350 77.3% 1,394,690 78.4%
NOOK 464,559 87.2% 311,197 106.0%
Total Cost of Sales and
Occupancy $ 5,218,383 73.2% $ 5,205,712 74.4%
The Company’s cost of sales and occupancy includes costs
such as merchandise costs, distribution center costs
(including payroll, freight, supplies, depreciation and
other operating expenses), rental expense, management
service agreement costs with schools, common area main-
tenance and real estate taxes, partially off set by landlord
tenant allowances amortized over the life of the lease.
Cost of sales and occupancy increased . million, or
., to . billion, in fi scal from . billion
in fi scal . Cost of sales and occupancy decreased as a
percentage of sales to . in fi scal from . in
fi scal . The decrease by segment is as follows:
• B&N Retail cost of sales and occupancy decreased as a
percentage of sales to . in fi scal from . in
fi scal . This decrease was primarily attributable to
sales mix, higher product margins and lower occupancy
costs.
• B&N College cost of sales and occupancy decreased as a
percentage of sales to . in fi scal from . in
fi scal . This decrease was primarily driven by a larger
mix of higher margin textbook rentals.
• NOOK cost of sales and occupancy decreased as a
percentage of sales to . in fi scal from .
in fi scal . This decrease was primarily attributable
to higher device margins and a heavier mix of higher
margin digital content.
Gross Margin
52 weeks ended
Dollars in thousands
April 28,
2012 % Sales
April 30,
2011 % Sales
B&N Retail $ 1,447,440 29.8% $ 1,427,010 29.0%
B&N College 395,311 22.7% 383,468 21.6%
NOOK 68,065 12.8% (17,625) (6.0)%
Total Gross Margin $ 1,910,816 26.8% $ 1,792,853 25.6%
The Company’s consolidated gross margin increased .
million, or ., to . billion, in fi scal from .
billion in fi scal . This increase was due to the matters
discussed above.
Selling and Administrative Expenses
52 weeks ended
Dollars in thousands
April 28,
2012 % Sales
April 30,
2011 % Sales
B&N Retail $ 1,130,311 23.3% $ 1,167,944 23.7%
B&N College 279,364 16.0% 270,022 15.2%
NOOK 329,777 61.9% 191,499 65.2%
Total Selling and
Administrative Expenses $ 1,739,452 24.4% $ 1,629,465 23.3%
Selling and administrative expenses increased .
million, or ., to . billion in fi scal from .
billion in fi scal . Selling and administrative expenses
increased as a percentage of sales to . in fi scal
from . in fi scal . The increase or (decrease) by
segment is as follows:
• B&N Retail selling and administrative expenses
decreased slightly as a percentage of sales to . in
fi scal from . in fi scal . This decrease was
primarily attributable to increased store productivity.
• B&N College selling and administrative expenses
increased as a percentage of sales to . in fi scal
from . in fi scal . This increase was primar-
ily attributable to deleveraging against the increase in
textbook rentals, which have a lower price than new or
used textbooks.
2012 Annual Report 15