Barnes and Noble 2012 Annual Report Download - page 16
Download and view the complete annual report
Please find page 16 of the 2012 Barnes and Noble annual report below. You can navigate through the pages in the report by either clicking on the pages listed below, or by using the keyword search tool below to find specific information within the annual report.-
 1
1 -
2
-
3
-
4
-
5
-
 6
6 -
 7
7 -
 8
8 -
 9
9 -
 10
10 -
 11
11 -
 12
12 -
 13
13 -
 14
14 -
 15
15 -
 16
16 -
 17
17 -
 18
18 -
 19
19 -
 20
20 -
 21
21 -
 22
22 -
 23
23 -
 24
24 -
 25
25 -
 26
26 -
27
-
28
-
29
-
30
-
31
-
32
-
33
-
34
-
35
-
36
-
37
-
38
-
39
-
40
-
41
-
42
-
43
-
44
-
45
-
46
-
47
-
48
-
49
-
50
-
51
-
52
-
53
-
54
-
55
-
56
-
57
-
58
-
59
-
60
-
61
-
62
-
63
-
64
-
65
-
66
-
67
-
68
-
69
-
70
-
71
-
72
 |
 |

In addition to NOOK® devices, the Company makes it easy
for customers to enjoy any book, anytime, anywhere with
its free line of NOOK® software specifi c application, which
has won the Webby People’s Voice Award. Customers can
use Barnes & Noble’s eReading software to access and read
books from their personal Barnes & Noble digital library
on devices including iPad™, iPhone®, Android™ smart-
phones and tablets, PC and Mac®. The Lifetime Library™
helps ensure that Barnes & Noble customers will always be
able to access their digital libraries on NOOK® products
and software-enabled devices and B&N.com. The Company
also off ers NOOK Newsstand™, which provides an exten-
sive selection of digital newspapers and magazines, avail-
able in both subscription and single copy format, NOOK
Kids™, a collection of digital picture and chapter books for
children and NOOK Study™, an innovative study platform
and software solution for higher education.
As digital and electronic sales become a larger part of its
business, the Company believes its footprint of more than
, stores will continue to be a major competitive asset.
The Company plans to integrate its traditional retail, trade
book and college bookstores businesses with its electronic
and Internet off erings, using retail stores in attractive
geographic markets to promote and sell digital devices and
content. Customers can see, feel and experiment with the
NOOK® in the Company’s stores.
Although the stores will be just a part of the off ering,
they will remain a key driver of sales and cash fl ow as the
Company expands its multi-channel relationships with
its customers. The Company does not expect to open retail
stores in new geographic markets or expand the total num-
ber of retail stores in the near future.
B&N College provides direct access to a large and well-
educated demographic group, enabling the Company to
build relationships with students throughout their college
years and beyond. The Company also expects to be the ben-
efi ciary of market consolidation as more and more schools
outsource their bookstore management. The Company is in
a unique market position to benefi t from this trend given
its full suite of services: bookstore management, textbook
rental and digital delivery.
Although the Company believes cash on hand, cash fl ows
from operating activities, funds available from its senior
credit facility and short-term vendor fi nancing provide the
Company with adequate liquidity and capital resources for
seasonal working capital requirements, the Company may
raise additional capital to support the growth of its digital
businesses.
52 WEEKS ENDED APRIL 28, 2012 COMPARED WITH
52 WEEKS ENDED APRIL 30, 2011
Sales
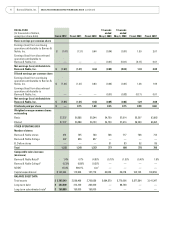
The following table summarizes the Company’s sales for the
weeks ended April , and April , :
52 weeks ended
Dollars in thousands
April 28,
2012 % Total
April 30,
2011 % Total
B&N Retail $ 4,852,913 68.1%$ 4,926,834 70.4%
B&N College 1,743,662 24.4% 1,778,159 25.4%
NOOK 933,471 13.1% 695,182 9.9%
Elimination (400,847) (5.6)% (401,610) (5.7)%
Total Sales $ 7,129,199 100.0% $ 6,998,565 100.0%
The Company’s sales increased . million, or .,
during fi scal to . billion from . billion during
fi scal . The increase or (decrease) by segment is as
follows:
• B&N Retail sales for fi scal decreased . million,
or ., to . billion from . billion during fi scal
, and accounted for . of total Company sales.
During fi scal comparable store sales increased
., which increased sales by . million, off set
by closed stores that decreased sales by . mil-
lion. Comparable physical book sales, including trade,
juvenile and bargain, were essentially fl at as the Company
benefi ted from the Borders liquidation. The increase
in comparable store sales was primarily attributable to
the strategic expansion of non-book categories, such as
NOOK® devices and accessories, Toys & Games and Gift
products. B&N Retail also includes its eCommerce busi-
ness and third-party sales of Sterling Publishing Co., Inc.
• B&N College sales decreased . million, or ., to
. billion during fi scal from . billion during
fi scal . The decrease in sales was primarily due to a
higher mix of textbook rentals, which have a lower price
than new or used textbooks. During fi scal compa-
rable store sales decreased ., primarily due to lower
textbook sales and partially off set by higher general mer-
chandise sales. Closed stores decreased sales by .
million off set by new B&N College stores contributing to
an increase in sales of . million.
14 Barnes & Noble, Inc. MANAGEMENT’S DISCUSSION AND ANALYSIS OF FINANCIAL CONDITION AND RESULTS OF OPERATIONS continued