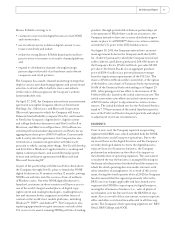
Barnes and Noble 2012 Annual Report Download - page 20
Download and view the complete annual report
Please find page 20 of the 2012 Barnes and Noble annual report below. You can navigate through the pages in the report by either clicking on the pages listed below, or by using the keyword search tool below to find specific information within the annual report.
Gross Margin
52 weeks ended
Dollars in thousands
April 30,
2011 % Sales
May 1,
2010 % Sales
B&N Retail $ 1,427,010 29.0% $ 1,561,578 31.6%
B&N College 383,468 21.6% 176,763 21.2%
NOOK (17,625) (6.0)% (61,596) (231.2)%
Total Gross Margin $ 1,792,853 25.6% $ 1,676,745 28.9%
The Company’s consolidated gross margin increased .
million, or ., to . billion in fi scal from .
billion in fi scal . This increase was due to the matters
discussed above.
Selling and Administrative Expenses
52 weeks ended
Dollars in thousands
April 30,
2011 % Sales May 1, 2010 % Sales
B&N Retail $ 1,167,944 23.7% $ 1,187,337 24.0%
B&N College 270,022 15.2% 155,613 18.7%
NOOK 191,499 65.2% 52,775 198.1%
Total Selling and
Administrative
Expenses $ 1,629,465 23.3% $ 1,395,725 24.0%
Selling and administrative expenses increased .
million, or ., to . billion in fi scal from .
billion in fi scal . Selling and administrative expenses
decreased as a percentage of sales to . in fi scal
from . in fi scal . The decrease by segment is as
follows:
• B&N Retail selling and administrative expenses
decreased as a percentage of sales to . in fi scal
from . in fi scal due to improved store
productivity.
• B&N College selling and administrative expenses,
included since the Acquisition on September , ,
decreased as a percentage of sales to . in fi scal
from . in fi scal . This decrease was primarily
attributable to the inclusion of the Fall back to school rush
period in fi scal , resulting in greater leverage on sales.
The Acquisition occurred after the Fall rush in .
• NOOK selling and administrative expenses decreased as
a percentage of sales to . in fi scal from .
in fi scal . This decrease was primarily attributable to
leveraging on increased sales.
Depreciation and Amortization
52 weeks ended
Dollars in thousands
April 30,
2011 % Sales
May 1,
2010 % Sales
B&N Retail $ 164,934 3.3% $ 170,777 3.5%
B&N College 43,148 2.4% 24,863 3.0%
NOOK 20,565 7.0% 12,134 45.6%
Total Depreciation and
Amortization $ 228,647 3.3% $ 207,774 3.6%
Depreciation and amortization increased . million, or
., to . million in fi scal from . million
in fi scal . This increase was primarily attributable to
the inclusion of the B&N College depreciation and amorti-
zation since the Acquisition on September , , which
increased . million to . million in fi scal from
. million during fi scal .
Operating Profi t (Loss)
52 weeks ended
Dollars in thousands
April 30,
2011 % Sales
May 1,
2010 % Sales
B&N Retail $ 94,132 1.9% $ 203,464 4.1%
B&N College 70,298 4.0% (3,713) (0.4)%
NOOK (229,689) (78.2)% (126,505) (474.9)%
Total Operating Profi t (Loss) $ (65,259) (0.9)% $ 73,246 1.3%
The Company’s consolidated operating profi t decreased
. million, or ., to an operating loss of .
million in fi scal from an operating profi t of .
million in fi scal . This decrease was due to the matters
discussed above.
Interest Expense, Net and Amortization of Deferred
Financing Fees
52 weeks ended
Dollars in thousands April 30, 2011 May 1, 2010 % of Change
Interest Expense, Net and
Amortization of Deferred
Financing Fees $ 57,350 $ 28,237 103.1%
Net interest expense and amortization of deferred fi nanc-
ing fees increased . million, to . million in fi scal
from . million in fi scal . This increase in
interest expense was primarily due to interest expense
related to debt from the Acquisition of B&N College,
investments made in digital and a . million write-off
of deferred fi nancing fees related to the amendment of the
Company’s credit facility.
18 Barnes & Noble, Inc. MANAGEMENT’S DISCUSSION AND ANALYSIS OF FINANCIAL CONDITION AND RESULTS OF OPERATIONS continued


