Barnes and Noble 2006 Annual Report Download - page 11
Download and view the complete annual report
Please find page 11 of the 2006 Barnes and Noble annual report below. You can navigate through the pages in the report by either clicking on the pages listed below, or by using the keyword search tool below to find specific information within the annual report.-
 1
1 -
 2
2 -
 3
3 -
 4
4 -
 5
5 -
 6
6 -
 7
7 -
 8
8 -
 9
9 -
 10
10 -
 11
11 -
 12
12 -
 13
13 -
 14
14 -
 15
15 -
 16
16 -
 17
17 -
 18
18 -
 19
19 -
 20
20 -
 21
21 -
 22
22 -
23
-
24
-
25
-
26
-
27
-
28
-
29
-
30
-
31
-
32
-
33
-
34
-
35
-
36
-
37
-
38
-
39
-
40
-
41
-
42
-
43
-
44
-
45
-
46
-
47
-
48
-
49
-
50
-
51
-
52
-
53
-
54
-
55
-
56
-
57
-
58
-
59
-
60
 |
 |

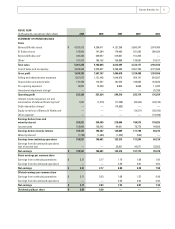
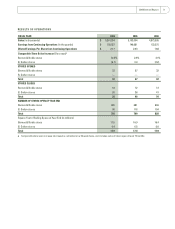
RESULTS OF OPERATIONS
FISCAL YEAR 2006 2005 2004
Sales (in thousands) $ 5,261,254 5,103,004 4,873,595
Earnings from Continuing Operations (in thousands) $ 150,527 146,681 123,375
Diluted Earnings Per Share from Continuing Operations $ 2.17 2.03 1.68
Comparable Store Sales Increase (Decrease)a
Barnes & Noble stores (0.3)% 2.9% 3.1%
B. Dalton stores (6.1) 0.9 (2.2)
STORES OPENED
Barnes & Noble stores 32 27 32
B. Dalton stores — — —
Total 32 27 32
STORES CLOSED
Barnes & Noble stores 18 12 13
B. Dalton stores 20 36 41
Total 38 48 54
NUMBER OF STORES OPEN AT YEAR END
Barnes & Noble stores 695 681 666
B. Dalton stores 98 118 154
Total 793 799 820
Square Feet of Selling Space at Year End (in millions)
Barnes & Noble stores 17.5 16.9 16.4
B. Dalton stores 0.4 0.5 0.6
Total 17.9 17.4 17.0
a Comparable store sales increase (decrease) is calculated on a 52-week basis, and includes sales of stores open at least 15 months.
2006 Annual Report 9