Barnes and Noble 2003 Annual Report Download - page 8
Download and view the complete annual report
Please find page 8 of the 2003 Barnes and Noble annual report below. You can navigate through the pages in the report by either clicking on the pages listed below, or by using the keyword search tool below to find specific information within the annual report.-
 1
1 -
 2
2 -
 3
3 -
 4
4 -
 5
5 -
 6
6 -
 7
7 -
 8
8 -
 9
9 -
 10
10 -
 11
11 -
 12
12 -
 13
13 -
 14
14 -
 15
15 -
 16
16 -
 17
17 -
 18
18 -
 19
19 -
20
-
21
-
22
-
23
-
24
-
25
-
26
-
27
-
28
-
29
-
30
-
31
-
32
-
33
-
34
-
35
-
36
-
37
-
38
-
39
-
40
-
41
-
42
-
43
-
44
-
45
-
46
-
47
-
48
-
49
-
50
-
51
-
52
-
53
-
54
-
55
-
56
-
57
-
58
 |
 |

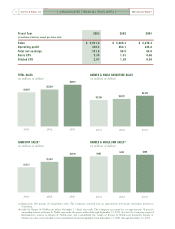
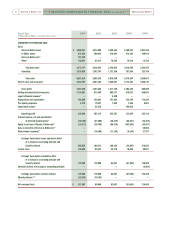
Fiscal Year 2003 (1) 2002 2001 2000(2) 1999(3)
(Thousands of dollars, except per share data)
Earnings (loss) per common share
Basic
Earnings (loss) before cumulative effect of
a change in accounting principle $ 2.30 1.51 0.96 ( 0.81 ) 1.87
Cumulative effect of a change
in accounting principle $ -- -- -- -- ( 0.07 )
Net earnings (loss) $ 2.30 1.51 0.96 ( 0.81 ) 1.80
Diluted
Earnings (loss) before cumulative effect of
a change in accounting principle $ 2.07 1.39 0.94 ( 0.81 ) 1.81
Cumulative effect of a change
in accounting principle $ -- -- -- -- ( 0.06 )
Net earnings (loss) $ 2.07 1.39 0.94 ( 0.81 ) 1.75
Weighted average common shares outstanding
Basic 65,989,000 66,362,000 66,393,000 64,341,000 69,005,000
Diluted 77,105,000 77,680,000 77,839,000 64,341,000 71,354,000
OTHER OPERATING DATA:
Number of stores
Barnes & Noble stores 647 628 591 569 542
B. Dalton stores 195 258 305 339 400
GameStop stores 1,514 1,231 1,038 978 526
Total 2,356 2,117 1,934 1,886 1,468
Comparable store sales increase (decrease)(11)
Barnes & Noble stores 3.2 % 0.0 % 2.7 % 4.9 % 6.1 %
B. Dalton stores ( 2.0 ) ( 6.4 ) ( 3.7 ) (1.7 ) 0.1
GameStop stores 0.8 11.4 32.0 ( 6.7 ) 12.5
Capital expenditures $ 163,387 179,545 168,833 134,292 146,294
BALANCE SHEET DATA:
Working capital $ 751,648 655,420 450,766 520,178 318,668
Total assets $ 3,507,294 2,995,427 2,623,220 2,557,476 2,413,791
Long-term debt $ 300,000 300,000 449,000 666,900 431,600
Long-term debt, net of cash $ (187,200 ) 32,358 340,782 640,897 407,353
Shareholders’ equity $ 1,259,659 1,027,790 888,110 777,677 846,360
[ SELECTED CONSOLIDATED FINANCIAL DATA continued ]
7
2003 Annual Report Barnes & Noble, Inc.