Barnes and Noble 2003 Annual Report Download - page 5
Download and view the complete annual report
Please find page 5 of the 2003 Barnes and Noble annual report below. You can navigate through the pages in the report by either clicking on the pages listed below, or by using the keyword search tool below to find specific information within the annual report.-
 1
1 -
 2
2 -
 3
3 -
 4
4 -
 5
5 -
 6
6 -
 7
7 -
 8
8 -
 9
9 -
 10
10 -
 11
11 -
 12
12 -
 13
13 -
 14
14 -
 15
15 -
 16
16 -
17
-
18
-
19
-
20
-
21
-
22
-
23
-
24
-
25
-
26
-
27
-
28
-
29
-
30
-
31
-
32
-
33
-
34
-
35
-
36
-
37
-
38
-
39
-
40
-
41
-
42
-
43
-
44
-
45
-
46
-
47
-
48
-
49
-
50
-
51
-
52
-
53
-
54
-
55
-
56
-
57
-
58
 |
 |

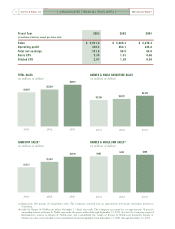
TOTAL SALES
(in millions of dollars)
BARNES & NOBLE BOOKSTORE SALES
(in millions of dollars)
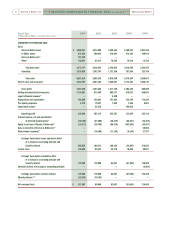
[ CONSOLIDATED FINANCIAL HIGHLIGHTS ]
4
2003 Annual ReportBarnes & Noble, Inc.
Fiscal Year 2003 2002 2001
(In millions of dollars, except per share data)
Sales $ 5,951.0 $ 5,269.3 $ 4,870.4
Operating profit 330.3 264.1 245.8
Total net earnings 151.9 99.9 64.0
Basic EPS 2.30 1.51 0.96
Diluted EPS 2.07 1.39 0.94
(a) Represents 100 percent of GameStop’s sales. The Company currently has an approximate 64 percent ownership interest in
GameStop.
(b) Sales for Barnes & Noble.com reflect December 31 fiscal year-ends. The Company accounted for its approximate 38 percent
ownership interest in Barnes & Noble.com under the equity method through September 15, 2003 (the date the Company acquired
Bertelsmann’s interest in Barnes & Noble.com) and consolidated the results of Barnes & Noble.com thereafter. Barnes &
Noble.com sales were included in the consolidated financial highlights from September 15, 2003 through December 31, 2003.
$5,951
GAMESTOP SALES(a)
(in millions of dollars)
BARNES & NOBLE.COM SALES(b)
(in millions of dollars)
2001 2002 2003 2001 2002 2003
$5,269
$4,870
$4,372
$3,917
$3,749
$423
$405
$1,579
$1,353
$1,121
2001 2002 2003 2001 2002 2003
$425