Barclays 2014 Annual Report Download - page 13
Download and view the complete annual report
Please find page 13 of the 2014 Barclays annual report below. You can navigate through the pages in the report by either clicking on the pages listed below, or by using the keyword search tool below to find specific information within the annual report.-
 1
1 -
2
-
 3
3 -
 4
4 -
 5
5 -
 6
6 -
 7
7 -
 8
8 -
 9
9 -
 10
10 -
 11
11 -
 12
12 -
 13
13 -
 14
14 -
 15
15 -
 16
16 -
 17
17 -
 18
18 -
 19
19 -
 20
20 -
 21
21 -
 22
22 -
 23
23 -
24
-
25
-
26
-
27
-
28
-
29
-
30
-
31
-
32
-
33
-
34
-
35
-
36
-
37
-
38
-
39
-
40
-
41
-
42
-
43
-
44
-
45
-
46
-
47
-
48
-
49
-
50
-
51
-
52
-
53
-
54
-
55
-
56
-
57
-
58
-
59
-
60
-
61
-
62
-
63
-
64
-
65
-
66
-
67
-
68
-
69
-
70
-
71
-
72
-
73
-
74
-
75
-
76
-
77
-
78
-
79
-
80
-
81
-
82
-
83
-
84
-
85
-
86
-
87
-
88
-
89
-
90
-
91
-
92
-
93
-
94
-
95
-
96
-
97
-
98
-
99
-
100
-
101
-
102
-
103
-
104
-
105
-
106
-
107
-
108
-
109
-
110
-
111
-
112
-
113
-
114
-
115
-
116
-
117
-
118
-
119
-
120
-
121
-
122
-
123
-
124
-
125
-
126
-
127
-
128
-
129
-
130
-
131
-
132
-
133
-
134
-
135
-
136
-
137
-
138
-
139
-
140
-
141
-
142
-
143
-
144
-
145
-
146
-
147
-
148
-
149
-
150
-
151
-
152
-
153
-
154
-
155
-
156
-
157
-
158
-
159
-
160
-
161
-
162
-
163
-
164
-
165
-
166
-
167
-
168
-
169
-
170
-
171
-
172
-
173
-
174
-
175
-
176
-
177
-
178
-
179
-
180
-
181
-
182
-
183
-
184
-
185
-
186
-
187
-
188
-
189
-
190
-
191
-
192
-
193
-
194
-
195
-
196
-
197
-
198
-
199
-
200
-
201
-
202
-
203
-
204
-
205
-
206
-
207
-
208
-
209
-
210
-
211
-
212
-
213
-
214
-
215
-
216
-
217
-
218
-
219
-
220
-
221
-
222
-
223
-
224
-
225
-
226
-
227
-
228
-
229
-
230
-
231
-
232
-
233
-
234
-
235
-
236
-
237
-
238
-
239
-
240
-
241
-
242
-
243
-
244
-
245
-
246
-
247
-
248
-
249
-
250
-
251
-
252
-
253
-
254
-
255
-
256
-
257
-
258
-
259
-
260
-
261
-
262
-
263
-
264
-
265
-
266
-
267
-
268
-
269
-
270
-
271
-
272
-
273
-
274
-
275
-
276
-
277
-
278
-
279
-
280
-
281
-
282
-
283
-
284
-
285
-
286
-
287
-
288
-
289
-
290
-
291
-
292
-
293
-
294
-
295
-
296
-
297
-
298
-
299
-
300
-
301
-
302
-
303
-
304
-
305
-
306
-
307
-
308
-
309
-
310
-
311
-
312
-
313
-
314
-
315
-
316
-
317
-
318
-
319
-
320
-
321
-
322
-
323
-
324
-
325
-
326
-
327
-
328
-
329
-
330
-
331
-
332
-
333
-
334
-
335
-
336
-
337
-
338
-
339
-
340
-
341
-
342
-
343
-
344
-
345
-
346
-
347
-
348
 |
 |

barclays.com/annualreport Barclays PLC Annual Report 2014 I 11
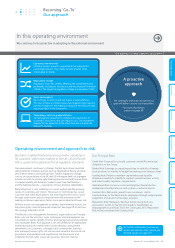
How we are doing
Introduction
In 2014 the Balanced Scorecard was used throughout
the organisation and now forms part of the framework
by which all staff are assessed. Individual performance
objectives were aligned with the 5Cs.
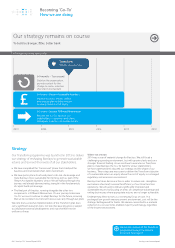
This year we have seen steady progress across the Scorecard towards
our 2018 targets especially in our Fully Loaded CRD IV CET1 ratio
metric where recent European Banking Authority and Bank of England
stress tests highlighted Barclays’ capital strength and resilience to
stress scenarios. There was however deterioration in the Colleague
Sustained Engagement and due to a restatement, a change in the
Customer & Client Relationship NPS metric. Work will be done through
2015 and beyond to improve these. The move in both metrics is
predominately due to changes Barclays has undergone through
2014 with the Strategy Update effecting structural change within the
organisation, and a change to a broader channel offering to our retail
customers with new technology. We will endeavour to improve both
scores with further colleague engagement, and greater help within our
retail network to adopt new technology as evidenced by our Digital
Eagles programme.
There is still work to do and we remain focused on our 2018 targets.
The following pages provide a review of each of the 5Cs.
Please see page 04 to see the
stakeholders for whom we have
designed the Balanced Scorecard
Becoming ‘Go-To’
Our Balanced Scorecard
Measures progress and performance against our goal
Metric Actual 2013 Actual 2014 Target 2018
Stakeholders and metrics
We have agreed eight key measures categorised into the 5Cs against which our stakeholders
can hold us to account. We are committed to monitoring and reporting on our progress annually.
PCB, Barclaycard and Africa Banking weighted average ranking of
Relationship Net Promoter Score® (NPS) vs. peer sets
Client Franchise Rank: Weighted average ranking of wallet share or
customer satisfaction with priority clients in the Investment Bank
Sustained engagement of colleagues score
% women in senior leadership
Citizenship Plan – initiatives on track or ahead
Conduct Reputation (YouGov survey)
Adjusted Return on Equity
Fully Loaded CRD IV CET1 ratio
3rda
N/A
74%
21%
10/11
5.2/10
4.1%b
9.1%c
4th
5th
72%
22%
11/11
5.3/10
5.1%
10.3%
1st
Top 3
87-91%
26%
Plan targets
6.5/10
>Cost of equity
>11%d
Customer
& Client
Colleague
Citizenship
Conduct
Company
Notes
a Revised due to creation of PCB as part of the May 2014 Strategy Update. Corporate clients now contribute to the NPS metric, and no longer contribute to
the Client Franchise Rank.
b Revised from 4.5%, post the Q213 £259m gain relating to assets not yet received from the US Lehman acquisition being treated as an adjusting item.
c Revised from 9.3%, post full implementation for CRD IV reporting in 2014.
d Revised from >10.5% following the Strategy Update.
Net Promoter, Net Promoter Score, and NPS are trademarks of Satmetrix Systems, Inc., Bain & Company, Inc., and Fred Reichheld.
Under the Companies Act 2006, we are also required to report on the gender breakdown of our employees and ‘senior managers’. Of our global
workforce of 132,300 (65,200 male, 67,100 female), 732 were senior managers (596 male, 136 female), which include Officers of the Group,
certain direct reports of the Chief Executive, heads of major business units, certain senior managing directors and directors on the boards of
undertakings of the Group, but exclude individuals who sit as directors on the board of the Company.
For our Customers and Clients
The Strategic Report Governance Risk review Financial review Financial statements Shareholder information