Barclays 2014 Annual Report Download - page 12
Download and view the complete annual report
Please find page 12 of the 2014 Barclays annual report below. You can navigate through the pages in the report by either clicking on the pages listed below, or by using the keyword search tool below to find specific information within the annual report.-
 1
1 -
 2
2 -
 3
3 -
 4
4 -
 5
5 -
 6
6 -
 7
7 -
 8
8 -
 9
9 -
 10
10 -
 11
11 -
 12
12 -
 13
13 -
 14
14 -
 15
15 -
 16
16 -
 17
17 -
 18
18 -
 19
19 -
 20
20 -
 21
21 -
 22
22 -
23
-
24
-
25
-
26
-
27
-
28
-
29
-
30
-
31
-
32
-
33
-
34
-
35
-
36
-
37
-
38
-
39
-
40
-
41
-
42
-
43
-
44
-
45
-
46
-
47
-
48
-
49
-
50
-
51
-
52
-
53
-
54
-
55
-
56
-
57
-
58
-
59
-
60
-
61
-
62
-
63
-
64
-
65
-
66
-
67
-
68
-
69
-
70
-
71
-
72
-
73
-
74
-
75
-
76
-
77
-
78
-
79
-
80
-
81
-
82
-
83
-
84
-
85
-
86
-
87
-
88
-
89
-
90
-
91
-
92
-
93
-
94
-
95
-
96
-
97
-
98
-
99
-
100
-
101
-
102
-
103
-
104
-
105
-
106
-
107
-
108
-
109
-
110
-
111
-
112
-
113
-
114
-
115
-
116
-
117
-
118
-
119
-
120
-
121
-
122
-
123
-
124
-
125
-
126
-
127
-
128
-
129
-
130
-
131
-
132
-
133
-
134
-
135
-
136
-
137
-
138
-
139
-
140
-
141
-
142
-
143
-
144
-
145
-
146
-
147
-
148
-
149
-
150
-
151
-
152
-
153
-
154
-
155
-
156
-
157
-
158
-
159
-
160
-
161
-
162
-
163
-
164
-
165
-
166
-
167
-
168
-
169
-
170
-
171
-
172
-
173
-
174
-
175
-
176
-
177
-
178
-
179
-
180
-
181
-
182
-
183
-
184
-
185
-
186
-
187
-
188
-
189
-
190
-
191
-
192
-
193
-
194
-
195
-
196
-
197
-
198
-
199
-
200
-
201
-
202
-
203
-
204
-
205
-
206
-
207
-
208
-
209
-
210
-
211
-
212
-
213
-
214
-
215
-
216
-
217
-
218
-
219
-
220
-
221
-
222
-
223
-
224
-
225
-
226
-
227
-
228
-
229
-
230
-
231
-
232
-
233
-
234
-
235
-
236
-
237
-
238
-
239
-
240
-
241
-
242
-
243
-
244
-
245
-
246
-
247
-
248
-
249
-
250
-
251
-
252
-
253
-
254
-
255
-
256
-
257
-
258
-
259
-
260
-
261
-
262
-
263
-
264
-
265
-
266
-
267
-
268
-
269
-
270
-
271
-
272
-
273
-
274
-
275
-
276
-
277
-
278
-
279
-
280
-
281
-
282
-
283
-
284
-
285
-
286
-
287
-
288
-
289
-
290
-
291
-
292
-
293
-
294
-
295
-
296
-
297
-
298
-
299
-
300
-
301
-
302
-
303
-
304
-
305
-
306
-
307
-
308
-
309
-
310
-
311
-
312
-
313
-
314
-
315
-
316
-
317
-
318
-
319
-
320
-
321
-
322
-
323
-
324
-
325
-
326
-
327
-
328
-
329
-
330
-
331
-
332
-
333
-
334
-
335
-
336
-
337
-
338
-
339
-
340
-
341
-
342
-
343
-
344
-
345
-
346
-
347
-
348
 |
 |

10 I Barclays PLC Annual Report 2014 barclays.com/annualreport
How we are doing
Business shape
Barclays will seek to improve returns significantly through
repositioning, simplifying and rebalancing. We intend to
be a focused international bank with four Core businesses,
operating only in areas where we have capability, scale
and competitive advantage
Q Personal & Corporate Banking: a combination of our leading UK
retail, corporate and wealth businesses, taking advantage of
infrastructure cost synergies
Q Barclaycard: a high returning business with strong and diversified
international growth potential
Q Africa Banking: a longer term regional growth business with clear
competitive advantages
Q Investment Bank: an origination-led and returns-focused business,
delivering Banking, Equities, Credit and certain Macro products to
our clients in a more capital efficient way
Barclays has also created Barclays Non-Core. This unit groups together
those assets that are not strategically attractive to us in the emerging
operating environment either because of structural shifts in the
external environment or because they remain too small with limited
opportunities for growth within our Group. Barclays will look to exit or
run down these assets over time in a considered and responsible way
that is respectful to those affected.
In the future, as a result of these changes, Barclays will be leaner,
stronger and much better balanced with an objective of delivering
lower volatility, higher returns, and growth. This model, moving rapidly
towards a better balance of activities and maintaining diversification,
will help us to achieve our Transform targets within the emerging
regulatory environment.
The Core Personal & Corporate Banking, Barclaycard and Africa
Banking businesses accounted for 45% of 2013 RWAs, with the Core
Investment Bank expected to represent no more than 30% of the
Group total by 2016, compared with just over 50% pre-Strategy
Update. Capital will be reallocated towards our growth businesses,
particularly Barclaycard and Africa, and we will continue to reduce our
cost base, with a core 2016 cost target of less than £14.5bn.
Overall, the rebalanced Group should deliver less volatile, and higher
profitability over time, with a more equal split across our diversified
portfolio of mature versus growth markets, investment banking versus
retail and corporate banking, and within the Investment Bank, trading
income versus advisory fees.
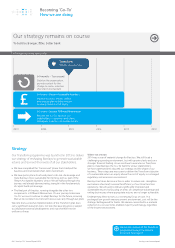
Becoming ‘Go-To’
For more information on our
businesses and their performance in
2014, please see page 17
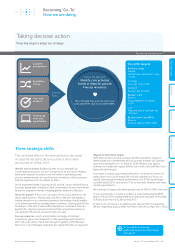
Reshaping the business
With a focus on running down Non-Core operations to provide investment for the Core growth businesses
c£120bn: Investment Bank
£120bn: Investment Bank
£110bn: Barclays Non-Core c£50bn: Barclays Non-Core
£210bn: Personal & Corporate Banking,
Africa Banking, Barclaycard and Head Office
c£230bn: Personal & Corporate Banking,
Africa Banking, Barclaycard and Head Office
Barclays PLC Group has been repositioned, simplified and rebalanced
2013 Total Risk Weighted Assets (RWAs):
£440bn
2016 Target Total RWAs:
c£400bn
RWAs are an important measure of capital allocations. As such we aim to better balance capital allocation for 2016.
Lorem ipsum Taking decisive action