Bank of Montreal 2004 Annual Report Download - page 21
Download and view the complete annual report
Please find page 21 of the 2004 Bank of Montreal annual report below. You can navigate through the pages in the report by either clicking on the pages listed below, or by using the keyword search tool below to find specific information within the annual report.-
 1
1 -
2
-
3
-
4
-
5
-
6
-
7
-
8
-
9
-
10
-
 11
11 -
 12
12 -
 13
13 -
 14
14 -
 15
15 -
 16
16 -
 17
17 -
 18
18 -
 19
19 -
 20
20 -
 21
21 -
 22
22 -
 23
23 -
 24
24 -
 25
25 -
 26
26 -
 27
27 -
 28
28 -
 29
29 -
 30
30 -
 31
31 -
32
-
33
-
34
-
35
-
36
-
37
-
38
-
39
-
40
-
41
-
42
-
43
-
44
-
45
-
46
-
47
-
48
-
49
-
50
-
51
-
52
-
53
-
54
-
55
-
56
-
57
-
58
-
59
-
60
-
61
-
62
-
63
-
64
-
65
-
66
-
67
-
68
-
69
-
70
-
71
-
72
-
73
-
74
-
75
-
76
-
77
-
78
-
79
-
80
-
81
-
82
-
83
-
84
-
85
-
86
-
87
-
88
-
89
-
90
-
91
-
92
-
93
-
94
-
95
-
96
-
97
-
98
-
99
-
100
-
101
-
102
-
103
-
104
-
105
-
106
-
107
-
108
-
109
-
110
-
111
-
112
-
113
-
114
-
115
-
116
-
117
-
118
-
119
-
120
-
121
-
122
-
123
-
124
-
125
-
126
-
127
-
128
-
129
-
130
-
131
-
132
-
133
-
134
 |
 |

BMO Financial Group Annual Report 2004 17
MD&A
Caution Regarding Forward-Looking Statements
Bank of Montreal’s public communications often include written or oral forward-looking statements. Statements of this type are included in this Annual
Report, and may be included in filings with Canadian securities regulators or the U.S. Securities and Exchange Commission, or in other communications.
All such statements are made pursuant to the “safe harbor” provisions of the United States Private Securities Litigation Reform Act of 1995. Forward-looking
statements may involve, but are not limited to, comments with respect to our objectives for 2005 and beyond, our strategies or future actions, our targets,
expectations for our financial condition or share price, and the results of or outlook for our operations or for the Canadian and U.S. economies.
By their nature, forward-looking statements require us to make assumptions and are subject to inherent risks and uncertainties. There is significant risk
that predictions and other forward-looking statements will not prove to be accurate. We caution readers of this document not to place undue reliance on
our forward-looking statements as a number of factors could cause actual future results, conditions, actions or events to differ materially from the targets,
expectations, estimates or intentions expressed in the forward-looking statements.
The future outcomes that relate to forward-looking statements may be influenced by many factors, including but not limited to: global capital market
activities; interest rate and currency value fluctuations; the effects of war or terrorist activities; the effects of disease or illness on local, national or international
economies; the effects of disruptions to public infrastructure, such as transportation, communications, power or water supply; industry and worldwide
economic and political conditions; regulatory and statutory developments; the effects of competition in the geographic and business areas in which
we operate; management actions; and technological changes. We caution that the foregoing list of factors is not exhaustive and that when relying on
forward-looking statements to make decisions with respect to Bank of Montreal, investors and others should carefully consider these factors, as well as
other uncertainties and potential events, and the inherent uncertainty of forward-looking statements. Bank of Montreal does not undertake to update
any forward-looking statement, whether written or oral, that may be made, from time to time, by the organization or on its behalf.
Management’s review of 2004 performance and what’s next.
The Introduction provides a brief overview of BMO Financial Group and explains the link between
our annual targets and our overall vision.
Financial Performance and Condition at a Glance provides an at-a-glance snapshot of our
results
on 11 key financial performance and condition measures used by management to
monitor performance
relative to our peer groups.
Enterprise-Wide Strategy and Economic Developments outlines our major strategy at the
enterprise level together with progress in relation to our 2004 strategic priorities. It also includes
commentary on the impact of economic developments on our businesses in 2004 and expectations
for the economy in 2005.
Value Measures reviews financial performance on the four key measures that assess or most directly
influence shareholder return.
Enterprise-Wide Financial Performance Review provides a detailed review of BMO’s consolidated
financial performance by major income statement category. It also includes explanations of the use
of non-GAAP measures and the impacts of changes in foreign exchange rates and acquired businesses.
Operating Group Financial Performance Review outlines the vision, strategies and major business
risks facing our operating groups, and the strengths and competencies that help them execute their
strategies in support of their visions. It also includes a summary of their achievements in 2004, priorities
for 2005 and a review of their financial performance for the year.
Financial Condition Review discusses our assets and liabilities by major balance sheet category.
It reviews our capital adequacy and our approach to ensuring we optimize our capital position
to support our business strategies and maximize returns to shareholders. It also discusses off-balance
sheet arrangements and financial instruments.
Accounting Estimates and Policies reviews critical accounting estimates and changes in accounting
policies in 2004 and 2005.
Enterprise-Wide Risk Management outlines our approach to managing the key financial and related
risks we face.
Supplemental Information
presents many useful financial tables and provides more historical detail.
Index
16 Introduction
17 Index
18 Financial Performance and
Condition at a Glance
Enterprise-Wide Strategy and
Economic Developments
21 Enterprise-Wide Strategy
22 Economic Developments
Value Measures
23 Total Shareholder Return
24 Earnings per Share Growth
25 Return on Equity
25 Net Economic Profit Growth
Financial Performance Review
Enterprise-Wide Review
26 Review of 2004
34 Review of 2003
Operating Group Review
35 Summary
36 Personal and Commercial Client Group
42 Private Client Group
45 Investment Banking Group
48 Corporate Support, including
Technology and Solutions
Financial Condition Review
49 Balance Sheet
51 Enterprise-Wide Capital Management
53 Off-Balance Sheet Arrangements
54 Financial Instruments
Accounting Estimates and Policies
55 Critical Accounting Estimates
57 Changes in Accounting Policies in 2004
57 Changes in Accounting Policies in 2005
58 Enterprise-Wide Risk Management
67 Quarterly Earnings Trends and
Review of Fourth Quarter Performance
70 Supplemental Information
Reading the MD&A
BMO’s President and Chief Executive Officer and Chief Financial Officer
have both signed a statement outlining management’s responsibility for financial
information in this Annual Report. The statement,
which can be found on
page 82, also explains the roles
of the Audit Committee and Board of Directors
in
respect of financial information in the Annual Report.
Management’s Discussion and Analysis comments on BMO’s operations and
financial condition for the years ended October 31, 2004 and 2003. The com-
mentary is as of November 23, 2004, except for peer group comparisons, which
are as of December 2, 2004. Unless otherwise indicated, all amounts are in
Canadian dollars and have been derived from financial statements prepared in
accordance with Canadian generally accepted accounting principles (GAAP).
BMO Financial Group Annual Report 2004 37
MD&A
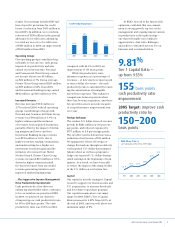
Continue to focus on revenue growth and improving operational
efficiency, while building our distribution capabilities, in order
to drive improvements in productivity. We set a target to
improve our cash productivity ratio by 150 to 200 bps in 2004.
•Revenue grew 1.5% and cash productivity improved by
90 bps. Revenue was reduced by a $65 million adjustment to
credit card fees associated with rising reward redemption
rates in our customer loyalty rewards program. Excluding
that adjustment, revenue would have increased 3.1%
and cash productivity would have improved by 190 bps.
•Revenue growth was affected by lower margins, driven by
the low interest rate environment and competitive pres-
sures. However, our focus on increasing revenues resulted
in strong balance sheet growth. Loans and acceptances,
after adding back the effects of securitizations, increased
$6.6 billion or 7.0% from 2003 and personal and com-
mercial deposits grew $3.4 billion or 9.1%.
Improve customer loyalty in both the personal and
commercial banking segments.
•Our customer loyalty scores, as measured by independent
research firms, improved in personal banking but were
unchanged in commercial banking in 2004 after improving
2004 Objectives and Achievements
steadily since 1999. Our service teams are now better able
to consistently address customer needs across all channels.
This was accomplished with the help of our customer
relationship management capabilities and Optimizer,
the leading-edge workflow management tool we released
to our personal banking sales and service staff in 2004.
Increase our business banking market share at a higher rate
than our major competitors and reduce the gap relative to the
market leader.
(1)
•We continued to rank second in business banking market
share for business loans less than $5 million. However,
our business banking market share decreased 45 bps
to 19.15% and the gap relative to the leader increased.
This is an important business that we are focused on
continuing to develop.
Increase our personal banking market share relative to our
major competitors.
(1)
•
Personal banking market share decreased 20 bps to 13.19%.
This was primarily due to a decline in market share in our
personal loan segment, despite 7.8% loan growth.*
(1)Year-over-year comparisons have been affected by competitor reclassifications in 2004.
*Includes securitized loans.
Deposits and Deposit Growth
in Canada
34.5
37.3
40.7
21.4
8.1 9.1
Growth (%)
Deposits ($ billions)
2002 2003 2004
Loans
and Loan Growth
in Canada*
87.7
93.6
100.2
7.6
6.7 7.0
Growth (%)
Loans ($ billions)
200420032002
P&C Canada Cash Productivity
Ratio and Revenue Growth
62.3
61.0
60.1
2.6
7.1
1.5
Revenue growth (%)
Cash productivity ratio (%)
200420032002
P&C Canada Net Income Growth
and Return on Equity (ROE)
26.8
29.1 28.4
3.4
17.3
5.9
Net income growth (%)
ROE (%)
200420032002
There was continued strong growth
in deposits.
Loan growth was solid and consistent.
*Includes acceptances and securitized loans
There were further productivity
improvements as revenue increased
and expenses were contained.
Net income growth was solid, with
consistently strong ROE.
What’s Next? Priorities for 2005
•Continue to focus on revenue growth while building our
distribution capabilities.
•Improve our cash productivity ratio by at least 150 bps.
•Improve customer loyalty in both the personal and
commercial banki ng segments.
During the year we created and enhanced various products:
•A number of simple and easy-to-purchase insurance
offerings, including accident and sickness, term life and
commercial loan l ife insurance.
•A new Canadian Tire
®
9
Commercial MasterCard for
commercial customers.
•Our Homeowner ReadiLine personal line of credit that
provides customers with easier access to credit.
•The attractiveness of our personal banking and credit card
offerings with the introduction of our Mosaik WestJet Air
Miles MasterCard. Gold card customers can deduct their
$70 annual fee from their personal banking service charges.
•A redesigned, fully integrated online banking web site to
make online banking easier and faster for our customers.
The new site provides a single point of entry and one
convenient menu that lets customers conduct transactions,
obtain product and rate information and access all our
other online services.
•
Maintain our personal banking market share and
increase our business banking market share relative
to our major competitors.
•Introduce further enhancements to our sales and service
delivery model to better meet the needs of our customers.
Other Achievements
BMO Financial Group Annual Report 200436
MD&A
Management’s Discussion and Analysis
Personal and Commercial Client Group – Canada
Group Description
Personal and Commercial Client Group (P&C), working together with BMO’s other
businesses, assists more than seven and a half million Canadians with their finan-
cial services needs. We offer a full range of products and services through almost
1,000 BMOBank of Montreal traditional and instore branches, telephone banking,online
banking at bmo.com, and our network of 2,000 automated banking machines.
Our personal and commercial banking business is among the five largest in Canada,
operating in a business environment that is increasingly competitive, particularly
with the recent growth in the number of small players operating in niche segments.
Vision
Our goal is to be the only financial services provider our personal and commercial
customers will ever need. We will reach this goal by providing exceptional transactional
sales and service, and by delivering a buying experience that is proactive and
advice-based. Our comprehensive and customized products and services will help
our customers better manage all aspects of their financial affairs.
Strategies
•
Continue to improve customer loyalty in both the personal and
commercial segments by proactively providing value-added products
and services to customers.
•
Maintain market share in the increasingly competitive personal segment
by providing competitive products and pricing, enhanced distribution
capabilities and exceptional customer service.
•
Be a leading provider of financial services to the commercial market-
place by providing a full suite of products and services tailored to
customer needs.
•
Further improve the alignment and capability of sales and service
resources to better meet customers’ needs.
•
Continue to simplify sales and fulfilment processes to improve our
customer experience, increase frontline capacity, and improve operational
and sales effectiveness.
Commercial Banking
includes both business and commercial
mid-market clients. We provide our business clients – inde-
pendent businesses, small and medium-sized enterprises, and
lower mid-market banking clients – with a full range of banking
products and services. These include cash management, loans
and deposits provided through our branches and direct banking
channels. For our commercial mid-market clients, our special-
ized sales force delivers a full suite of integrated commercial
and capital markets products and financial advisory services.
Through Moneris Solutions, we provide merchants with credit
and debit card transaction processing services.
Challenges
•Customer alternatives are expanding due to a growing num-
ber of competitors and easier access to competitors’ products.
•Traditional competitors are refocusing their strategies
on personal and com mercial banking.
•Pressure on margins is increasing due to heightened
price-based competition.
•Regulatory bodies are introducing new governance require-
ments that place greater demands on our resources.
Our Lines of Business
Personal Banking
provides solutions for customers’ every-
day banking, financing, investing and insurance needs.
We serve more than 20% of Canadian households.
Our national, fully coordinated, multi-channel distribution
system offers customers convenience and choice in where,
when and how they do their banking. We offer a full array
of services at competitive prices and an exclusive Air Miles
rewards program.
Strengths
•Top-tier organizational effectiveness supported by our sales
and service delivery model, with competitive multi-channel
distribution capabilities.
•Solid customer data management capabilities and tailored
offerings, including strong referrals both within the group and
to Private Client Group and Investment Banking Group.
•Sound technology platform facilitating efficient sales and
service across all channels.
•Ability to adapt to a challenging competitive environment
through competitive pricing and continuous improvement
to our services.
•Strong employee engagement, with a large and effective sales
force and disciplined sales and service management processes.
•Superior risk management capabilities that utilize a consis-
tent approach in all economic conditions.
Key Performance Drivers
(%) 2004 2003 2002
Deposit growth 9.1 8.1 21.4
Loan growth*7.0 6.7 7.6
Cash productivity ratio 60.1 61.0 62.3
Revenue growth 1.5 7.1 2.6
*Includes acceptances and securitized loans
Robert W. Pearce
President and Chief Executive Officer,
Personal and Commercial Client Group
–
Canada
Lead executive
Description,
vision and
strategy
Achievements
Supporting
information
and data