Bank of Montreal 2004 Annual Report Download - page 11
Download and view the complete annual report
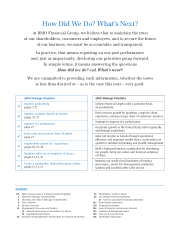
Please find page 11 of the 2004 Bank of Montreal annual report below. You can navigate through the pages in the report by either clicking on the pages listed below, or by using the keyword search tool below to find specific information within the annual report.-
 1
1 -
 2
2 -
 3
3 -
 4
4 -
 5
5 -
 6
6 -
 7
7 -
 8
8 -
 9
9 -
 10
10 -
 11
11 -
 12
12 -
 13
13 -
 14
14 -
 15
15 -
 16
16 -
 17
17 -
 18
18 -
 19
19 -
 20
20 -
 21
21 -
 22
22 -
23
-
24
-
25
-
26
-
27
-
28
-
29
-
30
-
31
-
32
-
33
-
34
-
35
-
36
-
37
-
38
-
39
-
40
-
41
-
42
-
43
-
44
-
45
-
46
-
47
-
48
-
49
-
50
-
51
-
52
-
53
-
54
-
55
-
56
-
57
-
58
-
59
-
60
-
61
-
62
-
63
-
64
-
65
-
66
-
67
-
68
-
69
-
70
-
71
-
72
-
73
-
74
-
75
-
76
-
77
-
78
-
79
-
80
-
81
-
82
-
83
-
84
-
85
-
86
-
87
-
88
-
89
-
90
-
91
-
92
-
93
-
94
-
95
-
96
-
97
-
98
-
99
-
100
-
101
-
102
-
103
-
104
-
105
-
106
-
107
-
108
-
109
-
110
-
111
-
112
-
113
-
114
-
115
-
116
-
117
-
118
-
119
-
120
-
121
-
122
-
123
-
124
-
125
-
126
-
127
-
128
-
129
-
130
-
131
-
132
-
133
-
134
 |
 |

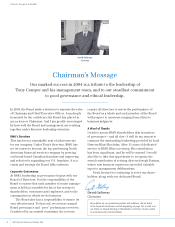
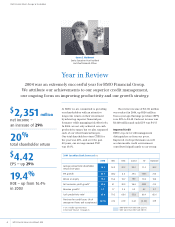
BMO Financial Group Annual Report 2004 7
results. Our earnings included $67 mil-
lion of specific provisions for credit
losses, a reduction from $455 million in
fiscal 2003. In addition, we recorded a
reduction of $170 million in the general
allowance for credit losses, adding up
to a total net recovery of credit losses
of $103 million in 2004, an improvement
of $558 million from 2003.
Operating Groups
Our operating groups contributed
sig-
nificantly to our success: each group
improved its productivity and also
earned record net income. Personal
and Commercial Client Group earned
net income of just over $1 billion,
up $66 million or 7% from a year ago.
Private Client Group earned $231 million,
up $87 million or 60% from 2003,
and Investment Banking Group earned
$856 million, up $135 million or 19%.
Increased Revenue...
Revenue increased $341 million or
3.7% in fiscal 2004, with all operating
groups contributing to this growth.
Personal and Commercial Client Group
revenue rose $90 million or 1.9% on
higher volumes and the inclusion
of revenues from acquired businesses,
partially offset by the impact of declin-
ing margins and lower card fees.
Investment Banking Group revenues
rose $176 million or 6.6%, due to
higher securities trading commissions
and underwriting fees, higher net
investment securities gains and the
inclusion of revenues from Harris
Nesbitt Gerard. Private Client Group
revenue increased $113 million or 6.5%,
driven by higher commission and
fee-based revenues from successful
revenue-generating initiatives and
improved market fundamentals.
...Plus Aggressive Expense Management
Drive Productivity Improvement
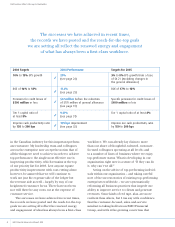
Cash productivity, a key driver in
enhancing shareholder value, continues
to be our number one priority at BMO.
In 2004, we achieved our objective
of improving our cash productivity ratio
by 150 to 200 basis points. The cash
productivity ratio was 63.0% in 2004,
At BMO, we look to the future with
optimism, confident that our commit-
ment to strong growth, top-tier credit
management and ongoing improvements
in productivity is the right strategy –
one that will enable us
to embrace
opportunities, deal with
challenges
and achieve continued success for
our
business and our shareholders.
compared with 64.5% in 2003, an
improvement of 155 basis points.
While the productivity ratio
measures expenses as a percentage of
revenues – or how much we must spend
to earn a dollar of revenue – the cash
productivity ratio is calculated by remov-
ing the amortization of intangible
assets from expenses. This enhances
comparisons between periods when
there has been an acquisition, and there-
fore provides a more accurate measure
of our performance improvement year
over year.
Foreign Exchange
The weaker U.S. dollar lowered revenue
growth by $243 million or 2.6 percent-
age points, and reduced expenses by
$177 million or 2.8 percentage points.
The net effect on the bottom line was a
reduction of net income of $35 million.
We manage the effects of foreign ex-
change fluctuations through a relatively
well-matched U.S.-dollar-denominated
balance sheet as well as a program to
hedge our expected U.S.-dollar-denomi-
nated earnings at the beginning of each
quarter. As a result, we have been able
to reduce the impact of the sharp decline
in the U.S. dollar on our bottom line.
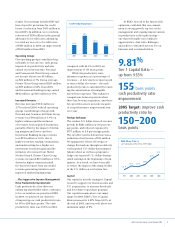
Capital
Our capital is actively managed. Capital
is used to support our business units and
U.S. acquisitions, to increase dividends
and for a share repurchase program.
Our capital remains above our target
range. In 2004, BMO’s Tier 1 Capital
Ratio increased to 9.81% from 9.55% at
the end of 2003, and was well above our
minimum target of 8%.
2004200320022001
Cash Productivity Ratio
63.5%
67.1%
64.5%
63.0%
9.81%
Tier 1 Capital Ratio
–
up from 9.55%
155 basis points
cash productivity ratio
improvement
2005 Target: improve cash
productivity ratio by
150–200
basis points
200420032002200120001999
BMO Share Price ($)
Last Trading Day of Fiscal Year (1999
–
2004)
28.33
35.25 33.86
38.10
49.33
57.55