Bank of Montreal 2004 Annual Report Download - page 10
Download and view the complete annual report
Please find page 10 of the 2004 Bank of Montreal annual report below. You can navigate through the pages in the report by either clicking on the pages listed below, or by using the keyword search tool below to find specific information within the annual report.-
 1
1 -
 2
2 -
 3
3 -
 4
4 -
 5
5 -
 6
6 -
 7
7 -
 8
8 -
 9
9 -
 10
10 -
 11
11 -
 12
12 -
 13
13 -
 14
14 -
 15
15 -
 16
16 -
 17
17 -
 18
18 -
 19
19 -
 20
20 -
 21
21 -
22
-
23
-
24
-
25
-
26
-
27
-
28
-
29
-
30
-
31
-
32
-
33
-
34
-
35
-
36
-
37
-
38
-
39
-
40
-
41
-
42
-
43
-
44
-
45
-
46
-
47
-
48
-
49
-
50
-
51
-
52
-
53
-
54
-
55
-
56
-
57
-
58
-
59
-
60
-
61
-
62
-
63
-
64
-
65
-
66
-
67
-
68
-
69
-
70
-
71
-
72
-
73
-
74
-
75
-
76
-
77
-
78
-
79
-
80
-
81
-
82
-
83
-
84
-
85
-
86
-
87
-
88
-
89
-
90
-
91
-
92
-
93
-
94
-
95
-
96
-
97
-
98
-
99
-
100
-
101
-
102
-
103
-
104
-
105
-
106
-
107
-
108
-
109
-
110
-
111
-
112
-
113
-
114
-
115
-
116
-
117
-
118
-
119
-
120
-
121
-
122
-
123
-
124
-
125
-
126
-
127
-
128
-
129
-
130
-
131
-
132
-
133
-
134
 |
 |

BMO Financial Group Annual Report 20046
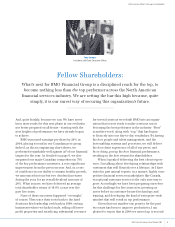
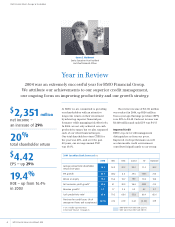
Chief Financial Officer’s Message to Shareholders
Karen E. Maidment
Senior Executive Vice-President
and Chief Financial Officer
Year in Review
2004 was an extremely successful year for BMO Financial Group.
We attribute our achievements to our superior credit management,
our
ongoing focus on improving productivity and our growth strategy.
At BMO, we are committed to providing
our shareholders with an attractive
long-term return on their investment
by achieving superior financial per-
formance while managing risk effectively.
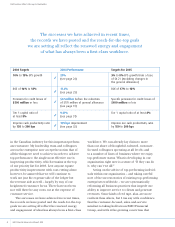
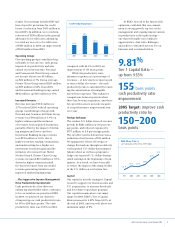
In 2004, we not only achieved our cash
productivity target, but we also surpassed
each of our other financial targets.
Our total shareholder return (TSR) for
the year was 20%, and over the past
20 years, our average annual TSR
was 17.5%.
Record net income of $2,351 million
was realized in 2004, up $526 million
from a year ago. Earnings per share (EPS)
rose 29% to $4.42. Cash net income was
$2,429 million and cash EPS was $4.57.
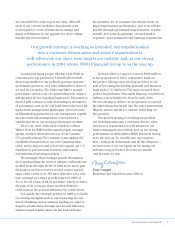
Improved Credit
BMO’s top-tier credit management
distinguishes us from our peers.
Improved credit performance as well
as a favourable credit environment
contributed significantly to our strong
$2,351million
net income
–
an increase of 29%
20%
total shareholder return
$4.42
EPS
–
up 29%
19.4%
ROE
–
up from 16.4%
in 2003
2004 Canadian Bank Scorecard (%)
BMO RBC CIBC Scotia TD National
Average annual total shareholder
return (five-year) 18.9 18.2 22.2 22.2 11.0 26.2
EPS growth 28.5 (3.6) 6.8 20.5 124.5 21.3
Return on equity 19.4 15.6 18.7 19.9 18.5 18.8
Net economic profit growth259.6 0.1 30.5 38.6 2332 41.4
Revenue growth1,2 3.7 1.7 2.8 0.2 8.2 5.7
Cash productivity ratio263.0 70.2 68.4 55.8 66.4 65.4
Provision for credit losses (% of
average net loans and acceptances) (0.07) 0.15 0.39 0.22 (0.25) 0.19
1. On a taxable equivalent basis. BMO better than other bank (25/35)
2. Non-GAAP measure. See page 26. BMO worse than other bank (10/35)